
The Brief:
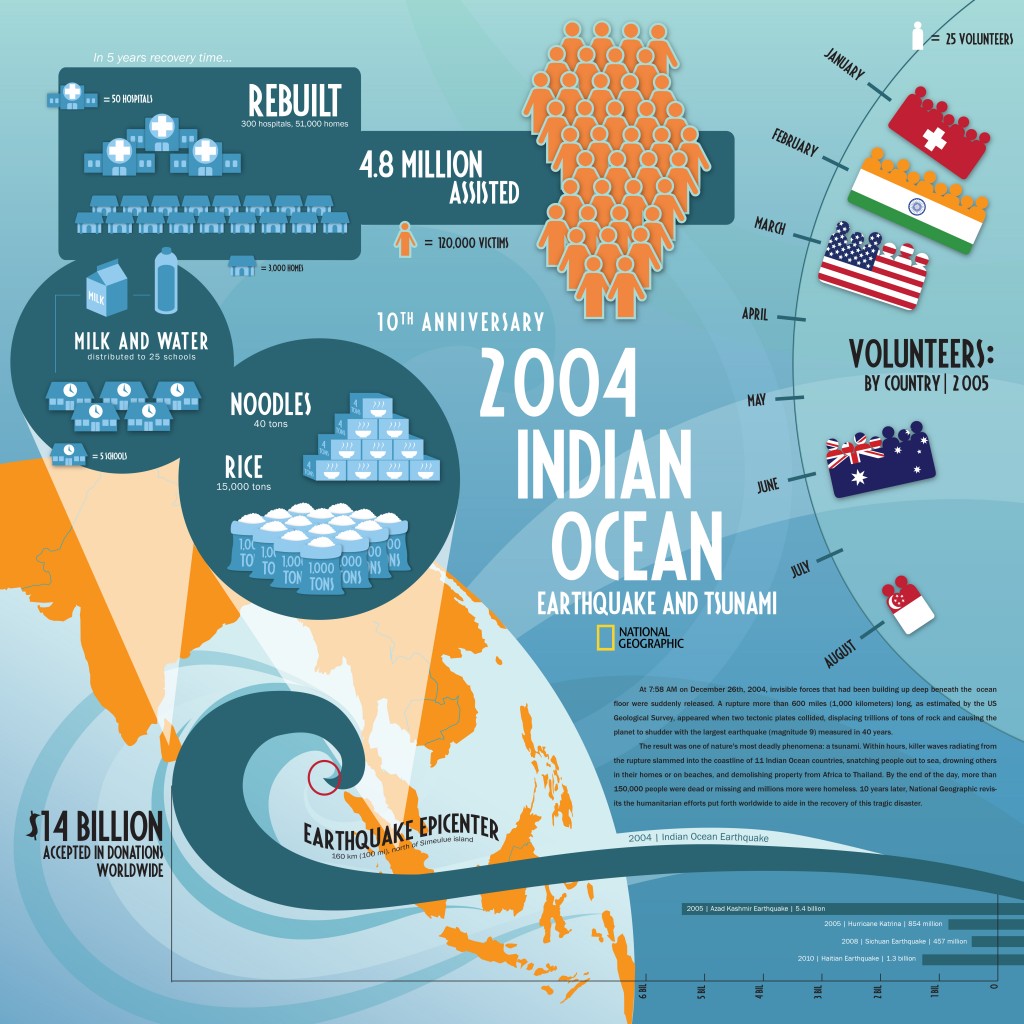
To produce a predominantly visual piece of info graphics to support National Geographic’s tenth anniversary special feature on the great Indian Ocean tsunami of 2004 which was estimated to have released the energy of 23,000 Hiroshima-type atomic bombs, according to the U.S. Geological Survey (USGS).
A mix of ‘layers’ presenting statistical, mapping and timeline information, while trying to retain a visual ‘tone of voice’ appropriate for such a humanitarian disaster: