A great final brief of the Spring semester Brand Experience class, to create awareness to the general public and potential sponsors/donors. Made all the more fun by being presented at the zoo with giraffes and rhino’s wandering past the window!

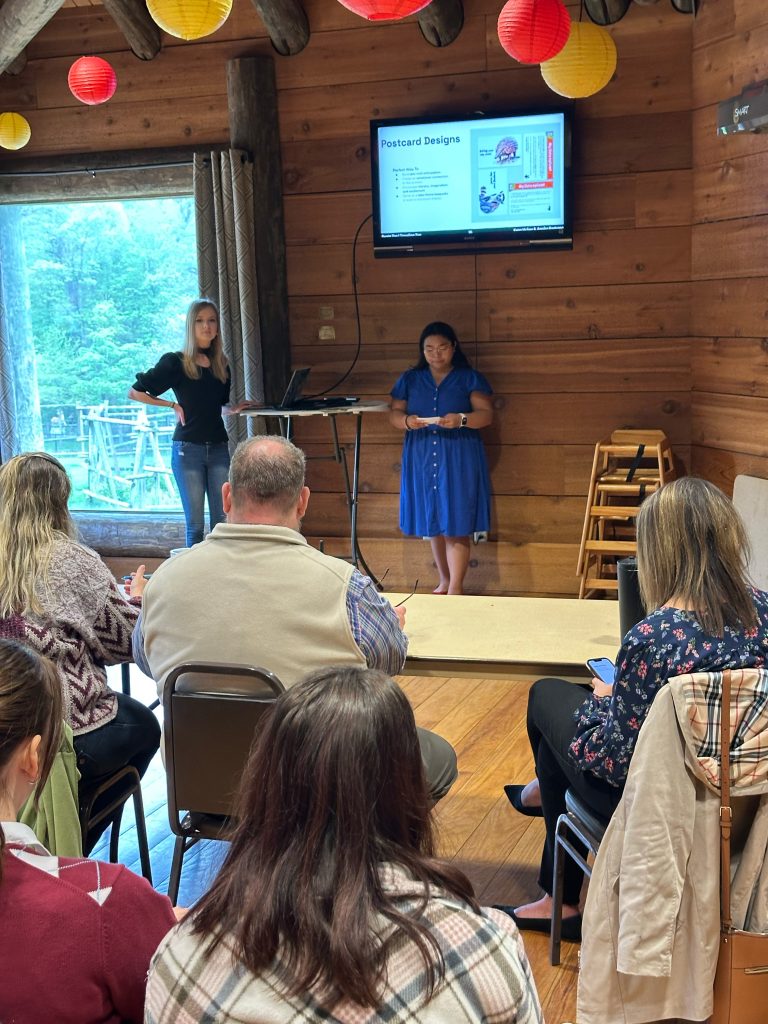
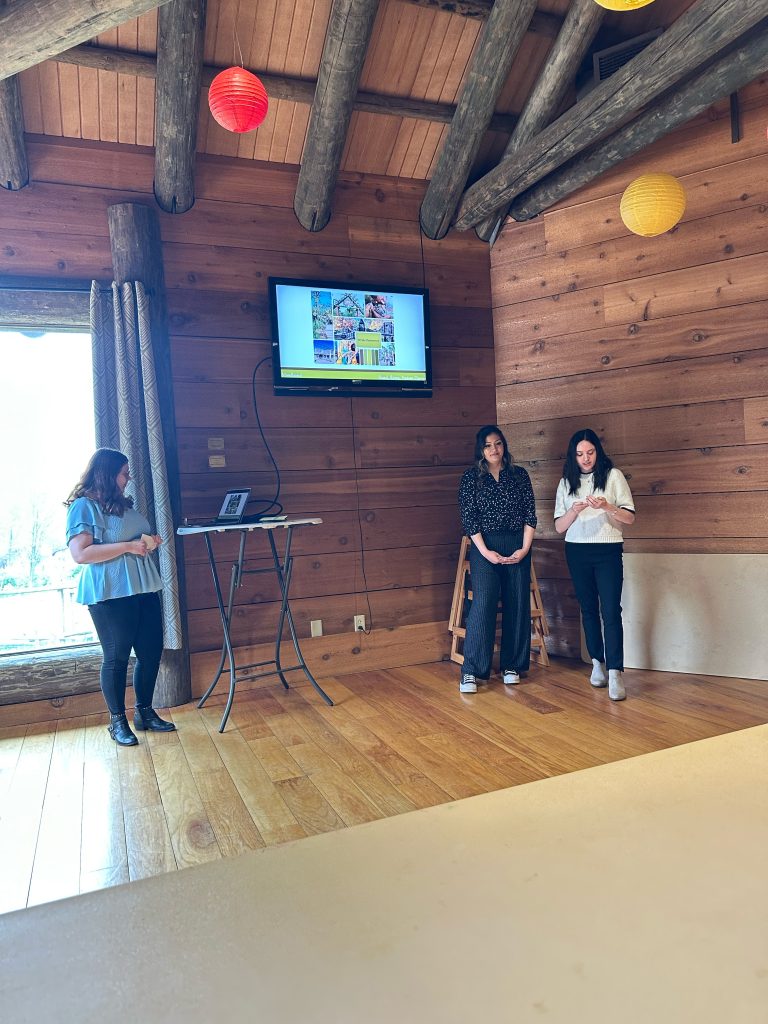
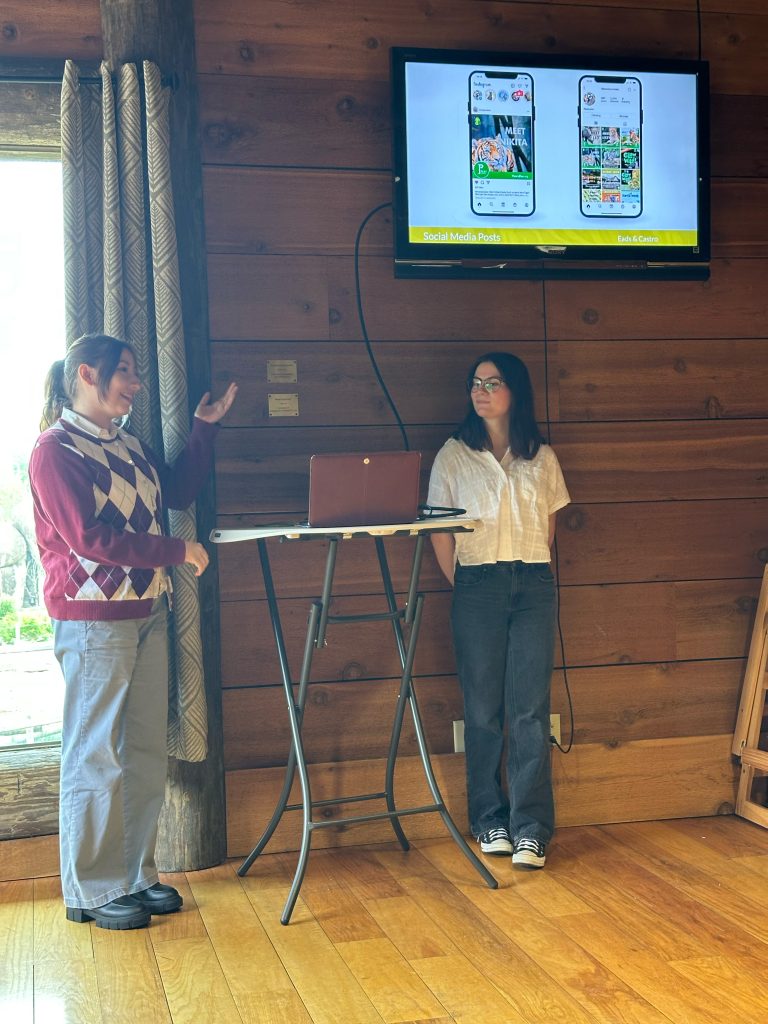
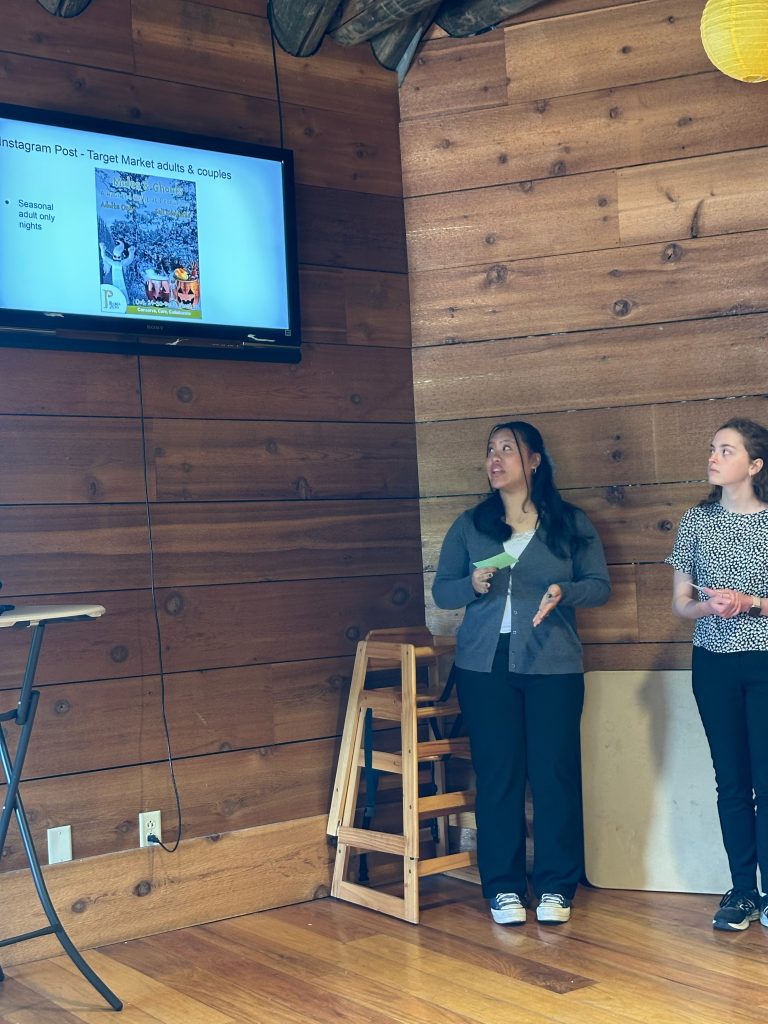
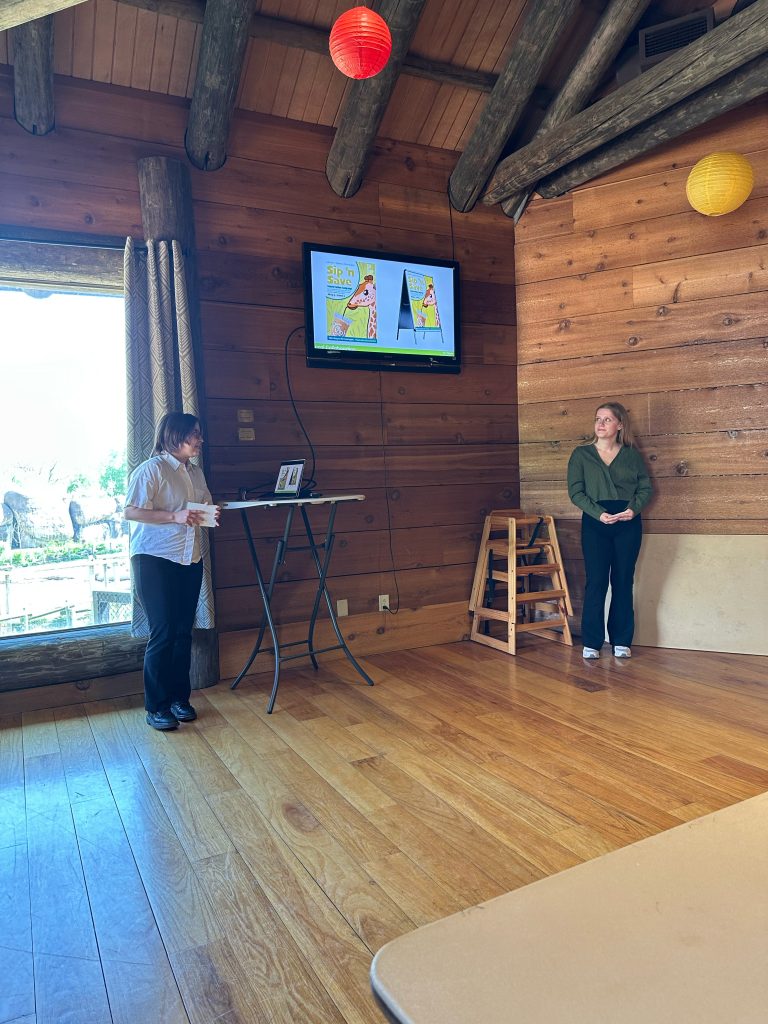
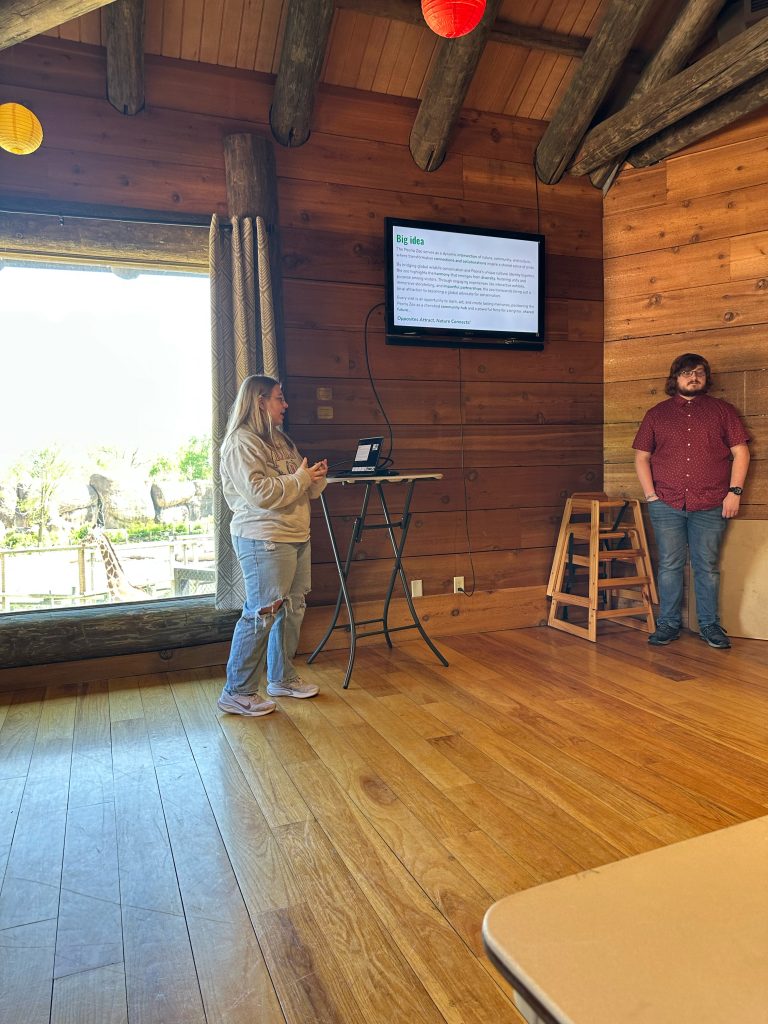


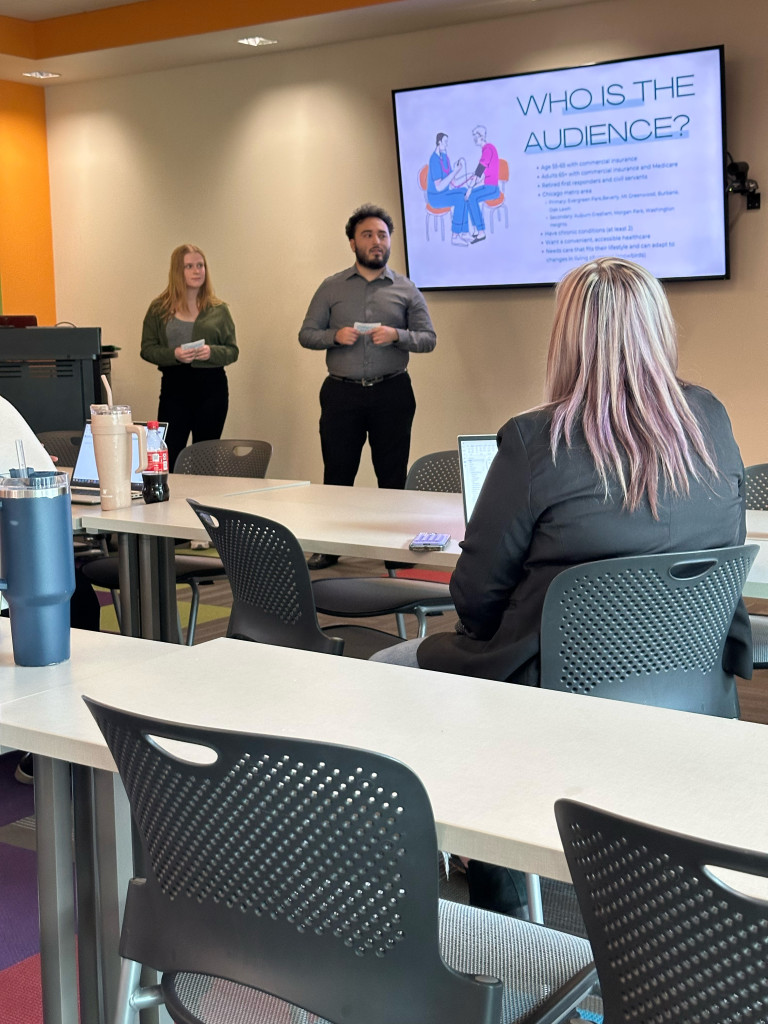
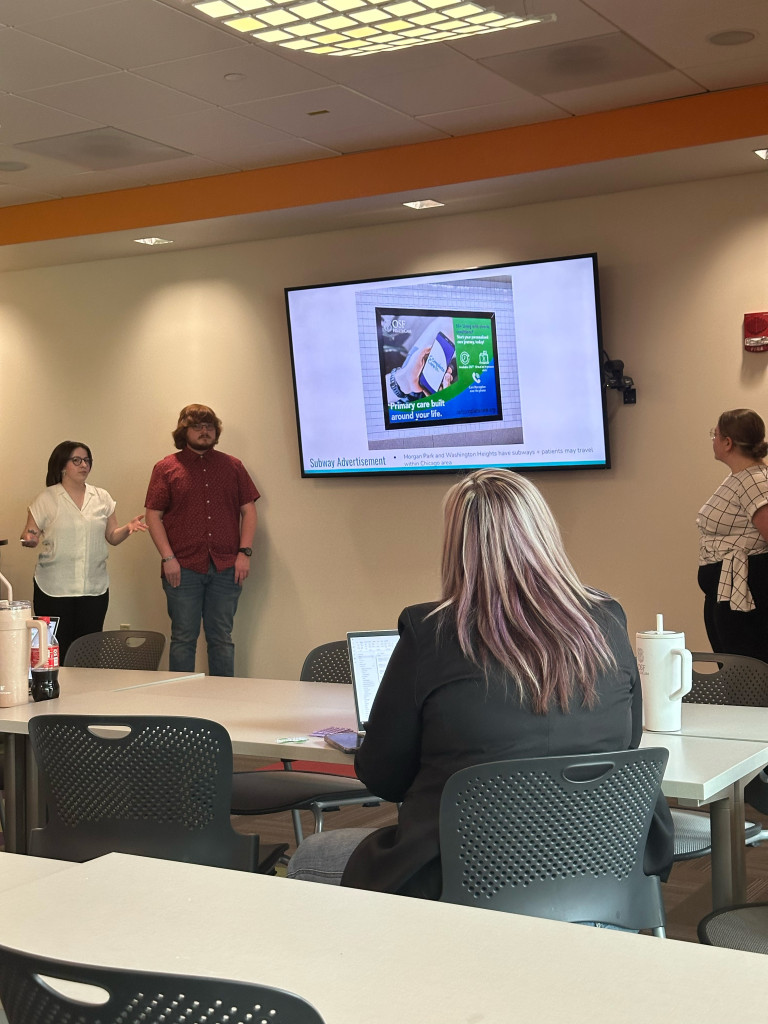
Art306 Brand Experience students were required, in teams, to create a strategic campaign to promote awareness for a new hybrid care program through OSF, titled ‘CompleteCare 55+’. Presentation decks were then pitched to the ‘clients’. Thank you Shelly and co. for a wonderful, challenging, brief.




c/o D&AD 2020
What’s the challenge?
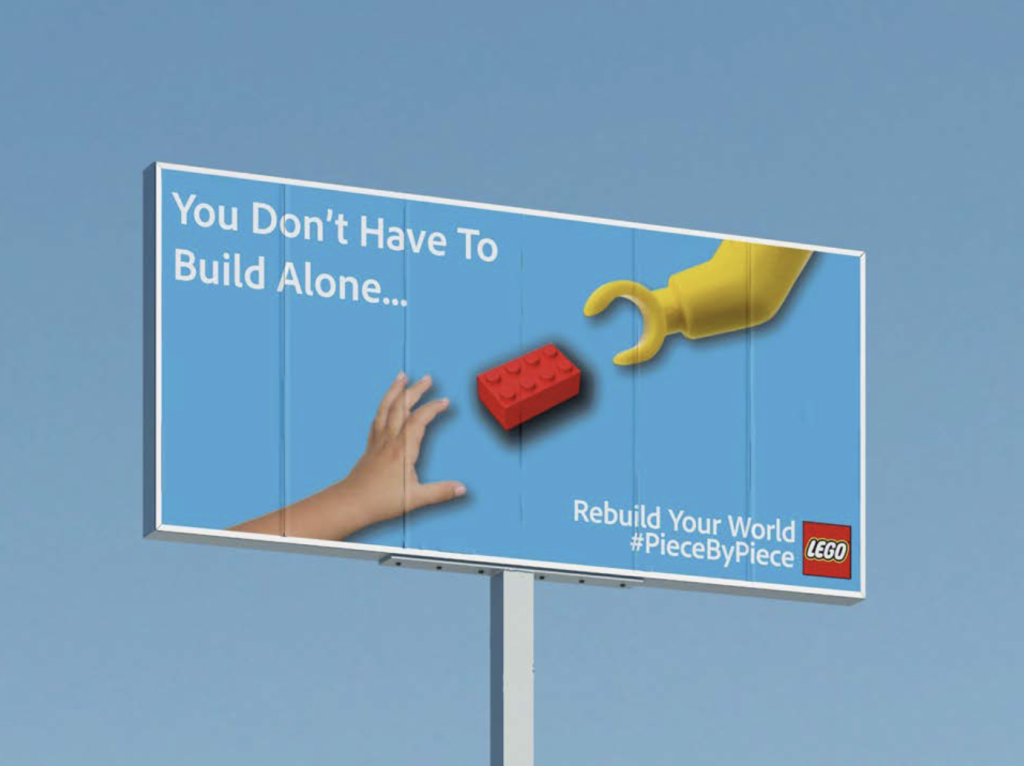
The LEGO Group want you to create a powerful campaign that appeals to teenagers and rebuilds their relationship with the LEGO® brand (bricks) – on their terms.
The campaign needs to encourage and inspire teens, who have advanced into new creative spaces such as music, film, sport and fashion etc., to take notice and use LEGO® bricks to make creative statements and actions that really matter to them, and the world around them.
The campaign needs to reach teenagers anywhere in the world aged 13-18 years old.
It’s your job to discover what will appeal to this audience, and what will distract them, but consider some of the tensions that they can face, the idea of wanting to stand out whilst, on the other hand, wanting to fit in and feel a part of something.
How can you encourage strong minded teenagers to use these products to challenge the status quo? Your creative canvas is bigger than advertising.
Here are four complete student presentation decks, plus some images of the rest…



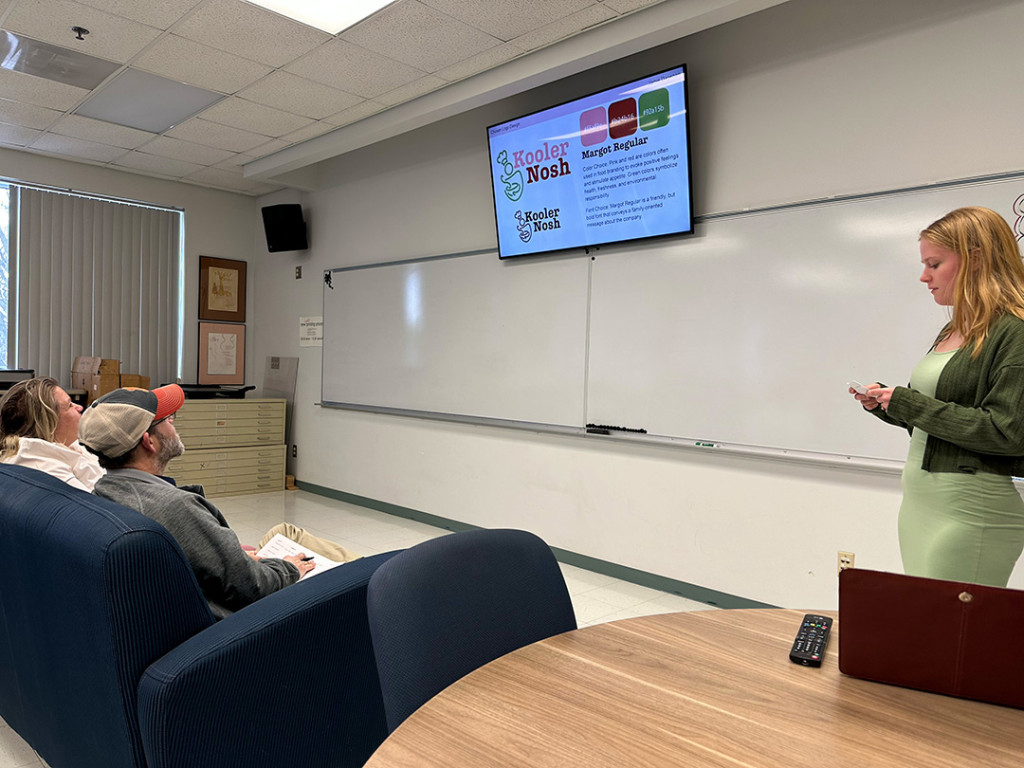
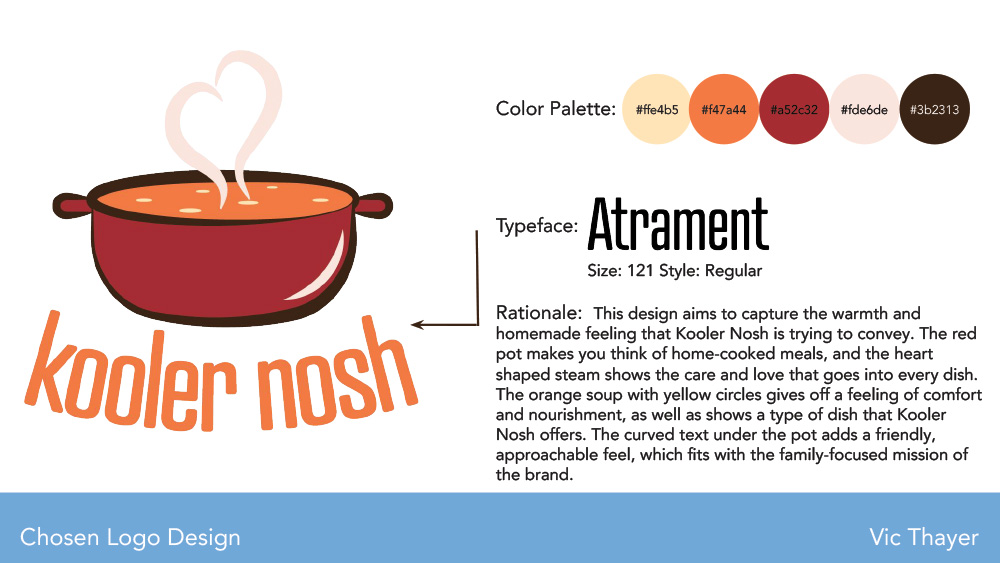
Kooler Nosh provides families with frozen pre-made meals, side dishes, and desserts that are homemade. We offer crockpot meals & foods cooked in the oven. Kooler Nosh offers various food product lines such as Casseroles, Soups, Breakfast, Paleo, Keto, Carnivore, Clean Eating, for the Grill, Side Dishes and more. Our goal is to reduce the time it takes for meal preparation so that families can have time at the dinner table together.
Kooler Nosh is dedicated to providing families with frozen pre-made meals that taste like homemade cooking. Our goal is to make it easy for families to enjoy sit-down dinners together, even during busy days filled with children’s activities and sports events. We also cater to those who can’t cook for themselves anymore, ensuring they have access to nutritious and convenient meals.
The future of the company for the next 5 years is to build a strong, repeat customer base within 50 miles of Peoria, IL. We intend to stay local rather than expand commercially and open ourselves up to larger liability. If the market and our income will support it, we’d like to offer a retail location where customers can stop in to buy frozen or freshly prepared meals, side dishes, desserts and more.




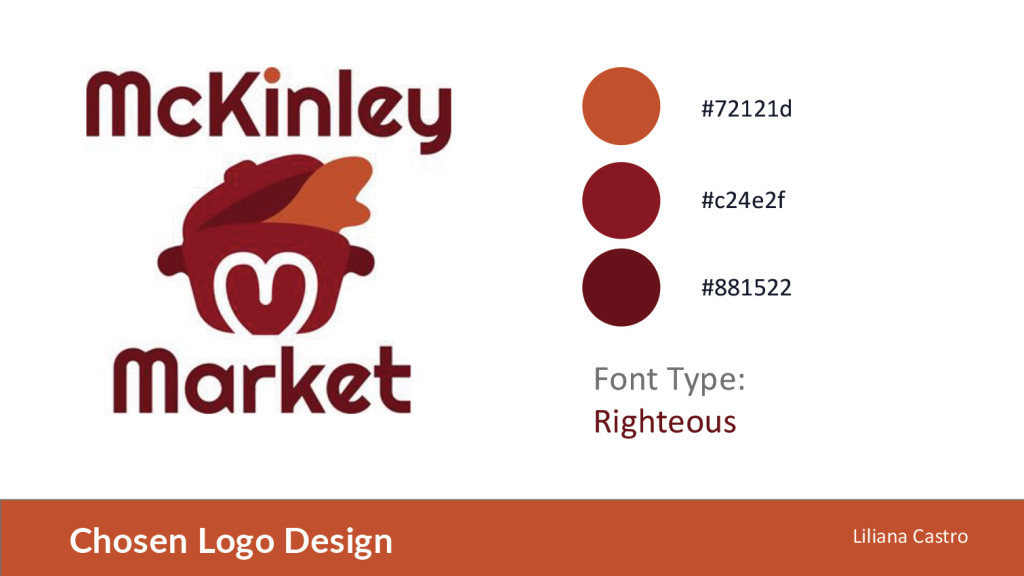
Our primary project for the next ten years revolves around building a truly holistic and accessible culinary experience for those living gluten-free. While our current offerings are focused on crafting indulgent, high-quality baked goods—think cookies, pastries, breads, and other delightful treats—the vision for the future is much broader and more expansive.
Our ideal customers value authenticity, quality ingredients, and the experience of supporting small, local businesses. They are likely to appreciate the unique, personalized atmosphere of a farmers market, where they can connect with the makers and learn about the origins of their food.
Additionally, our offerings will appeal to busy parents, professionals, and individuals looking for convenient, flavorful gluten-free options. These customers want products that don’t compromise on taste, and they enjoy knowing they can serve great meals that everyone at the table can enjoy, regardless of dietary restrictions.
Ultimately, our target audience consists of people who want to enjoy delicious, inclusive food that brings people together—whether they’re at the farmers market, at home, or sharing a meal with family and friends.



April 9-13, 2025 in the Meyer Jacobs Theatre
At a rural high school in Georgia, a group of students study Arthur Miller’s The Crucible while navigating love, sex ed, and a few school scandals. Holding their own lens to the American classic, they begin to question who is really the play’s hero, and as their insights grow they discover their own agency as individuals and their power as a community of young women. Compelling, irreverent, and bitingly funny, this new comedy by an acclaimed American playwright captures a generation in mid-transformation, fueled by pop music, optimism, and fury.
The final production for the 2024-2025 season, and most likely my last collaboration with Scott Kanoff, who has been the most wonderful client to ‘bounce off’ for the past decade of theatre poster artwork.

The final Information Design class of the semester saw the Senior Graphic Design students remotely present wall charts to Tanner Woodford, Founder & Executive Director and Kevin Reader, Executive Director of Programming & Operations, at the Design Museum of Chicago.
The subject of the wall charts was focused on the Chicago Brewery scene and the brewing process itself, and may well feature in a large exhibition at the museum proposed for next fall on the Chicago brewpub culture.
Great final assignment. Great group of students.


