
Never tire of this one. The students first venture into taking assorted qualitative and quantitative data, and presenting it as visual information graphics.
Once again, some really nice interpretations.
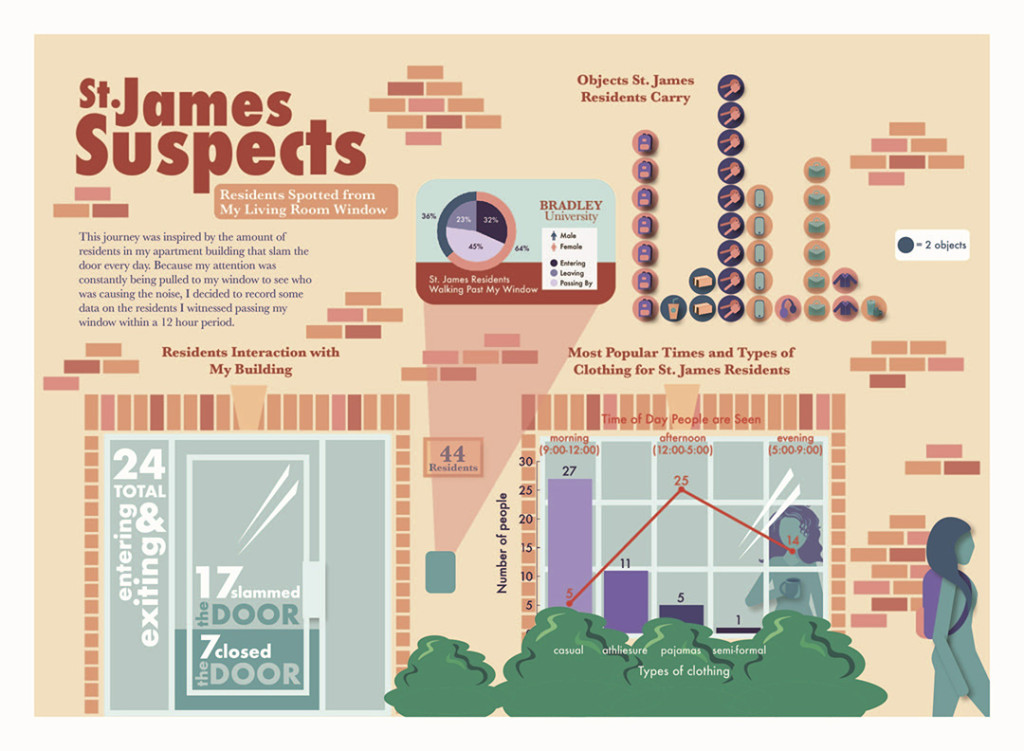
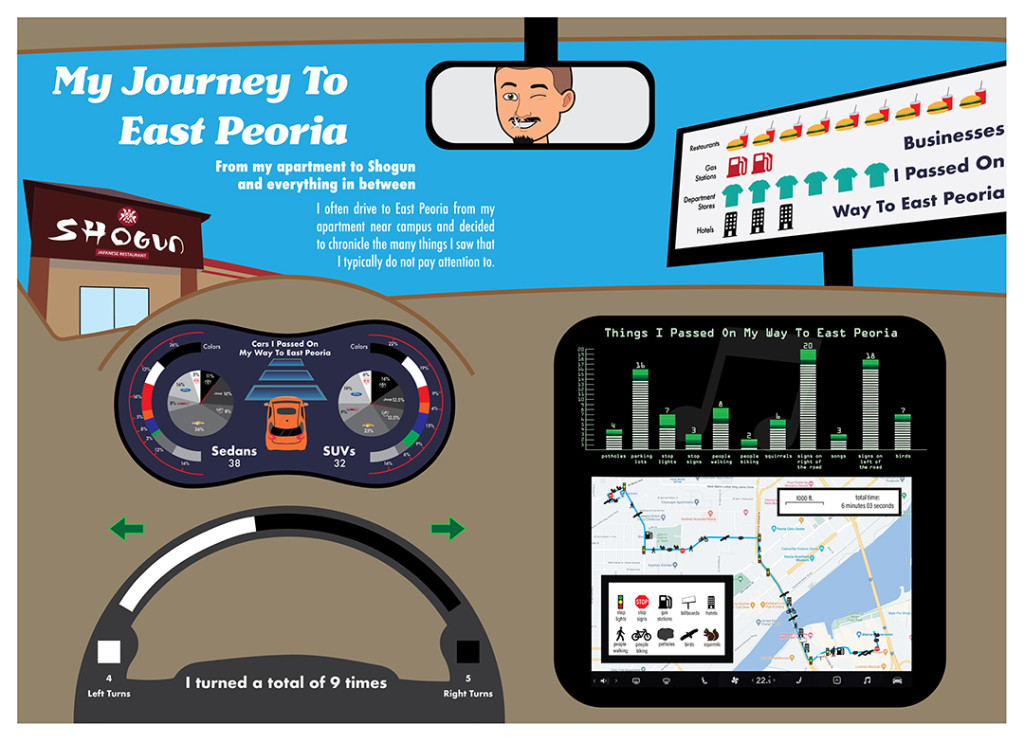
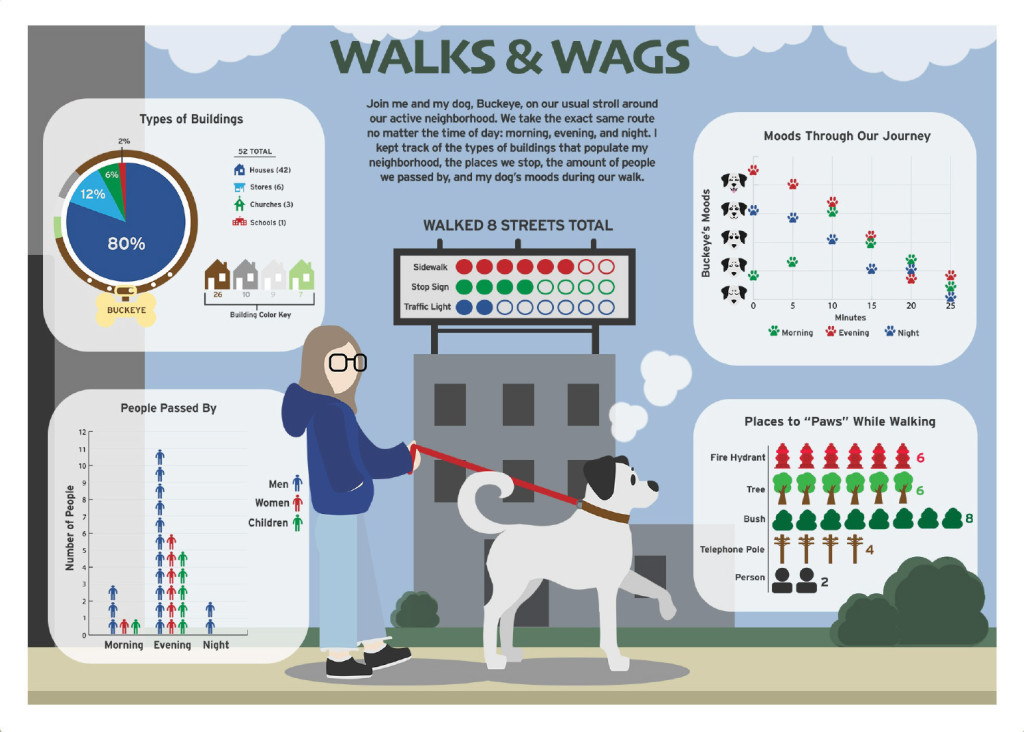


Never tire of this one. The students first venture into taking assorted qualitative and quantitative data, and presenting it as visual information graphics.
Once again, some really nice interpretations.