
Unforgettable

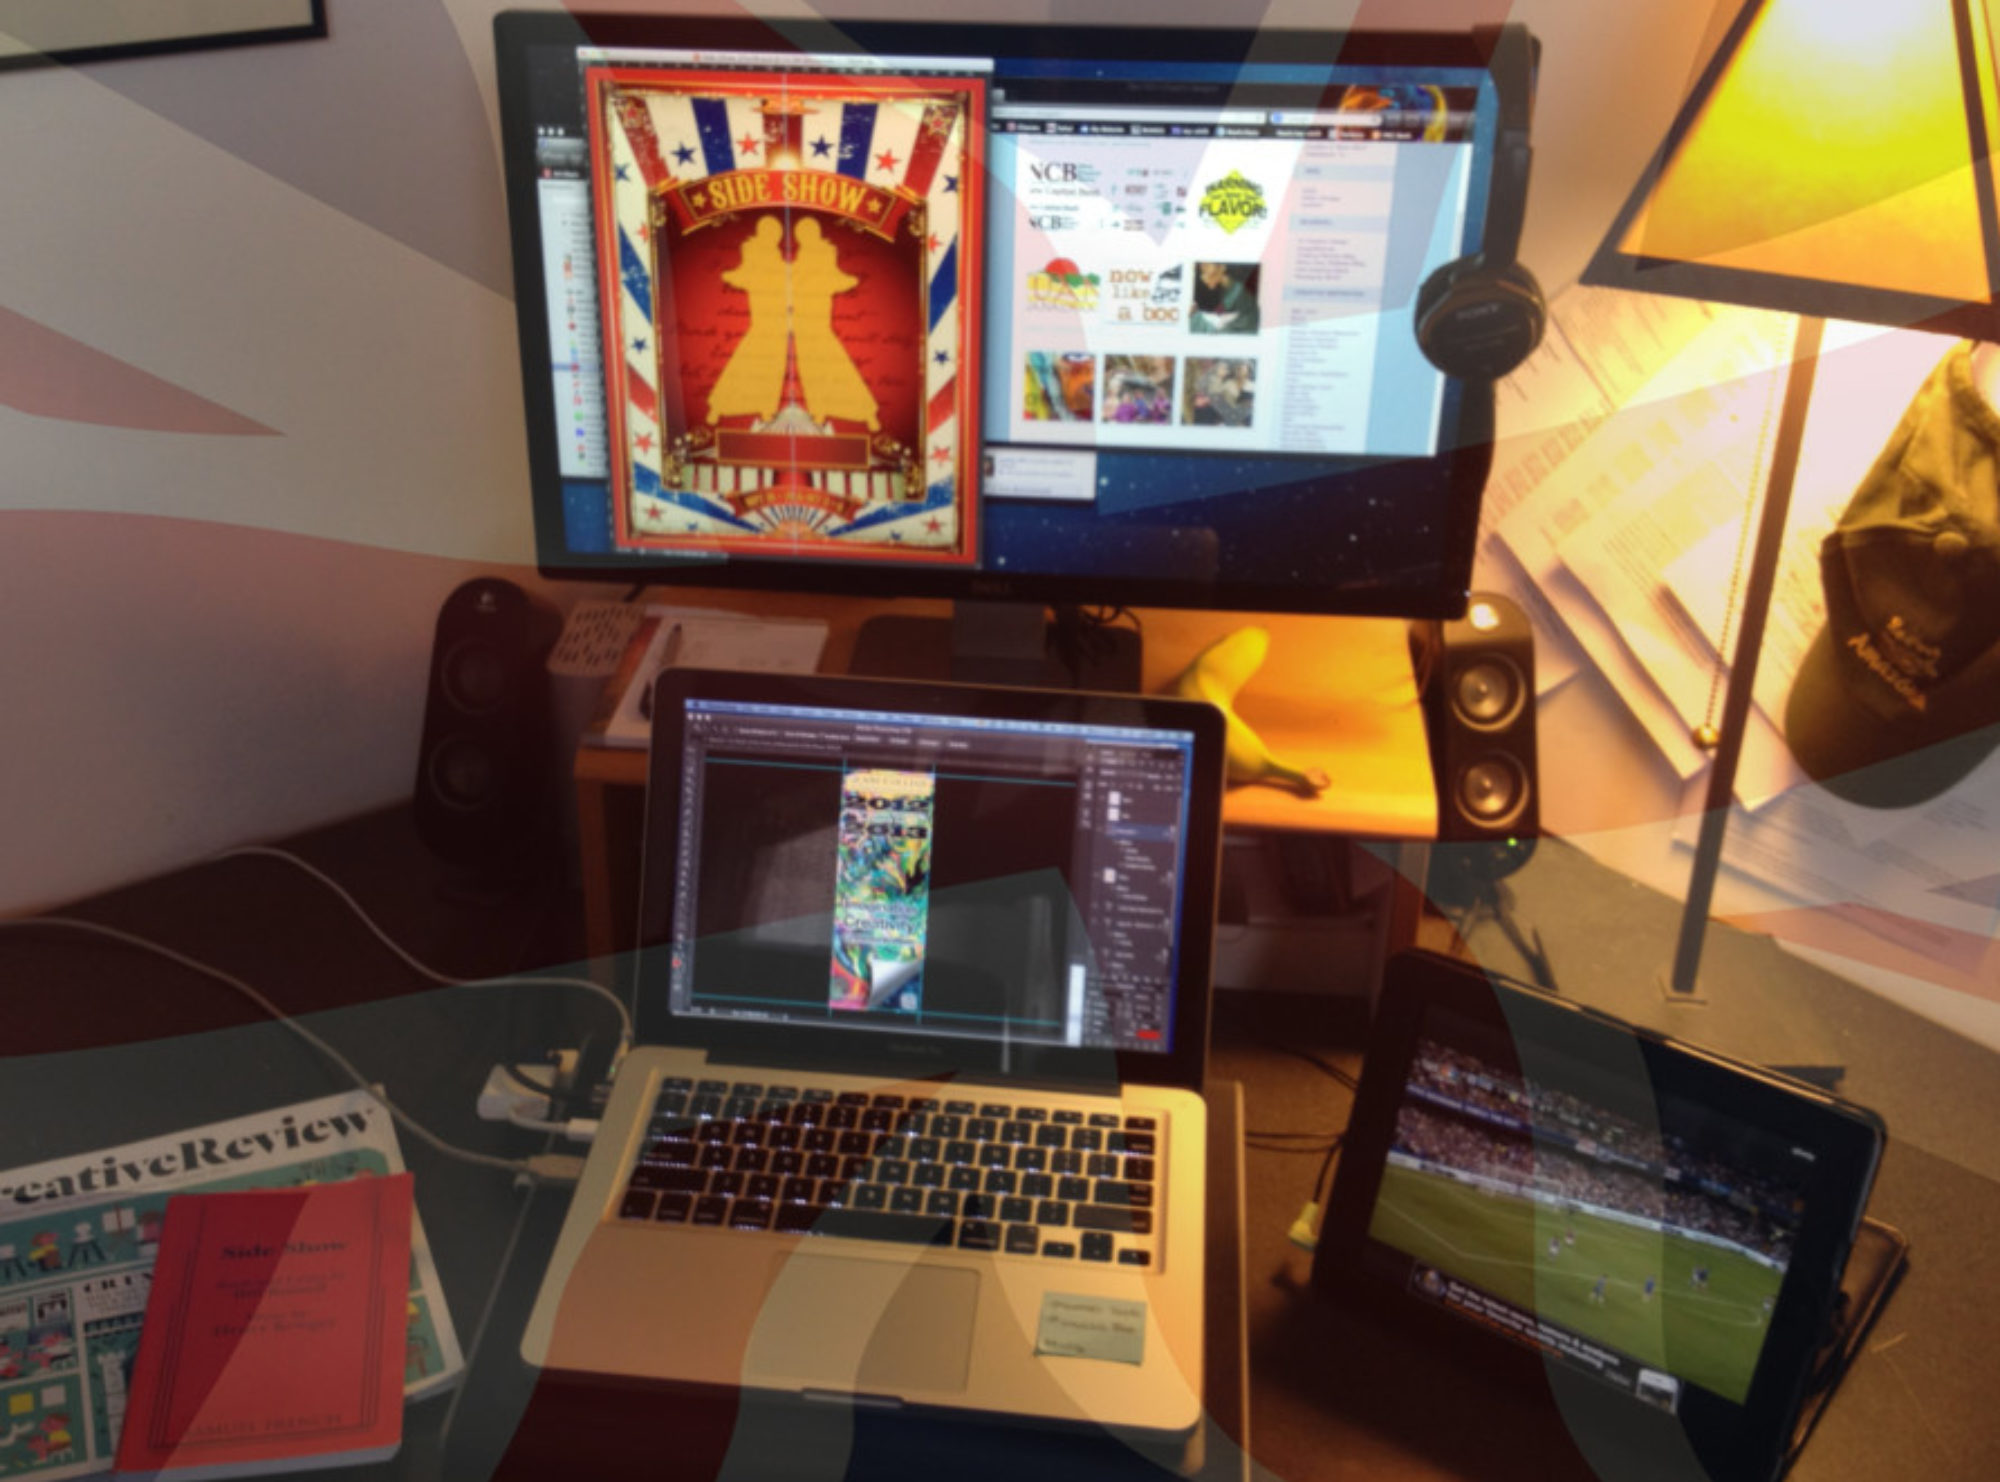
Fun poster to work on with a pretty tight deadline. Here is some of the thought process:


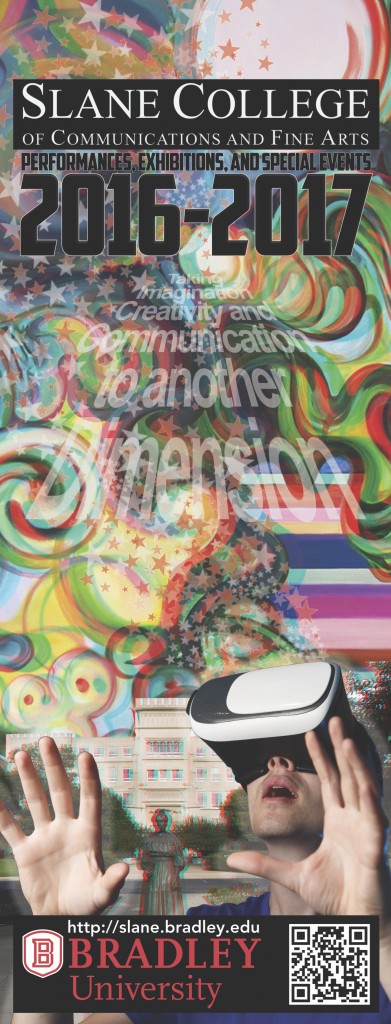
Annual Slane CFA Events Poster… in 3D
Yes, you do need the anaglyph glasses to view this. Better still, a pair of trioscopic glasses. Each poster went out with a cardboard pair of the latter.
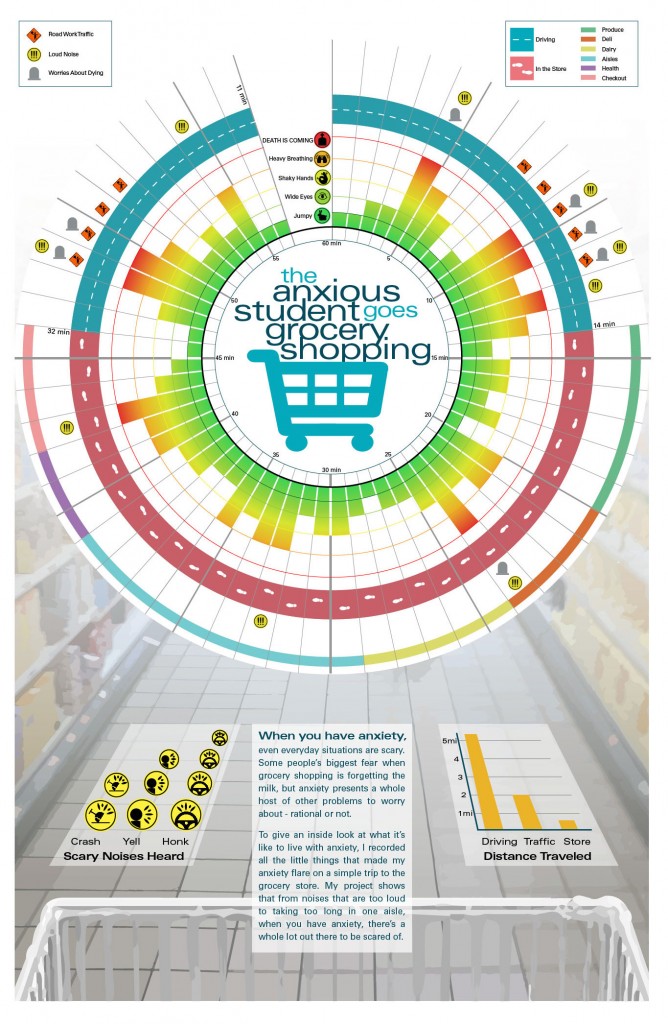
My Personal Journey
Nice introduction assignment into presentation of qualitative and quantitative data in a visual but clear and accurate way, retaining graphic integrity and truthful representation throughout. Each student had to research a personal journey of their choice and collate as much primary and secondary data as possible from that journey. Everything from the number of stop signs, to the breeds of dogs out walking. From the information collected, they then had to create a wallchart presenting it as a visual interpretation.