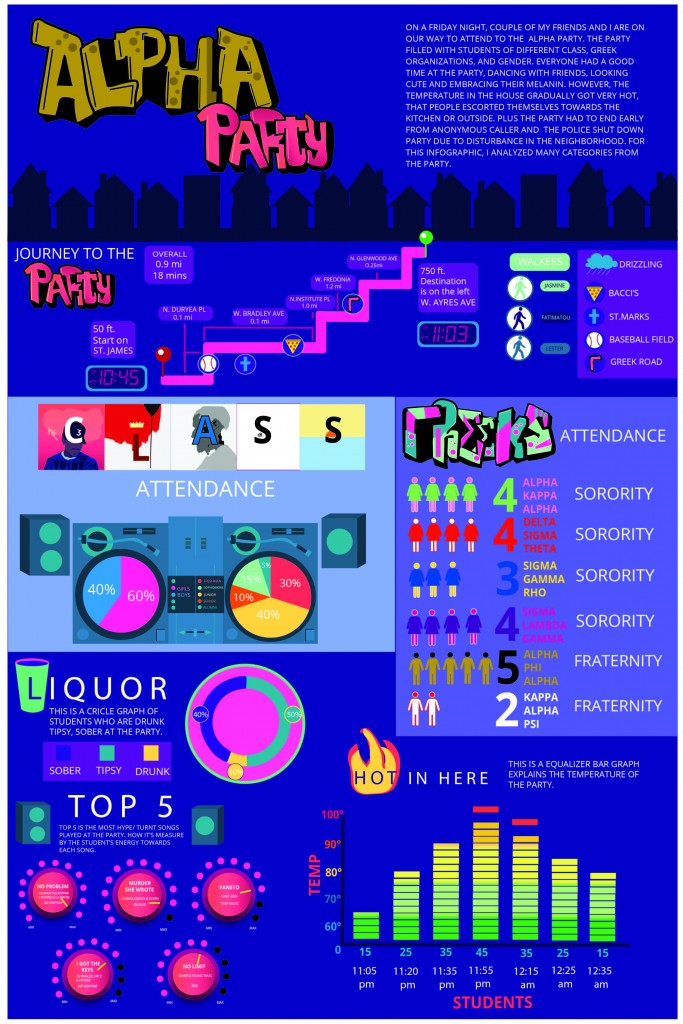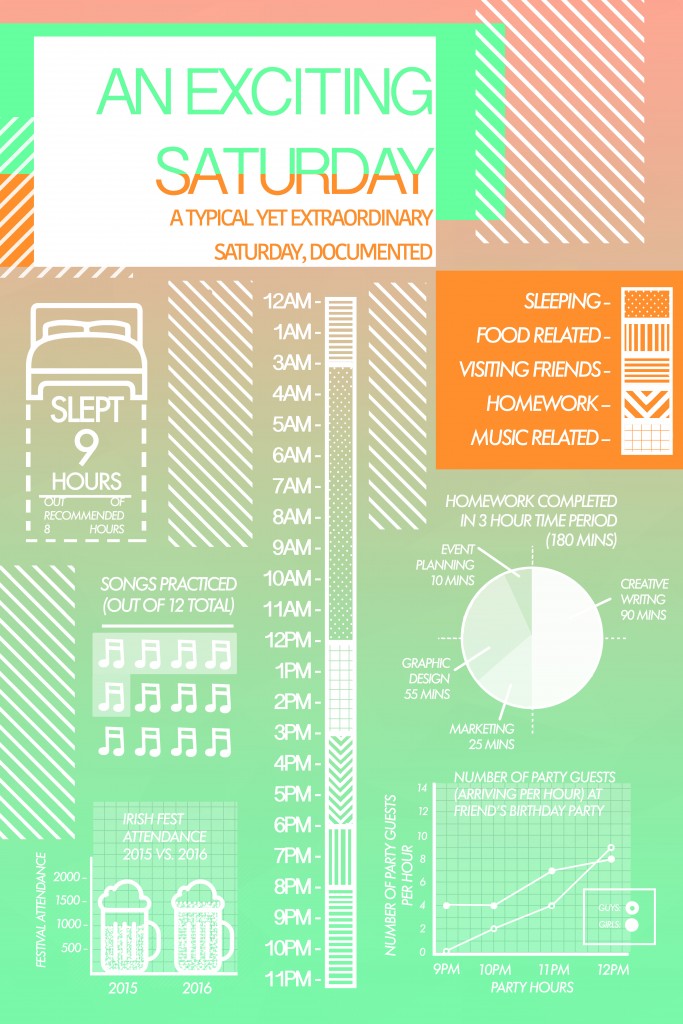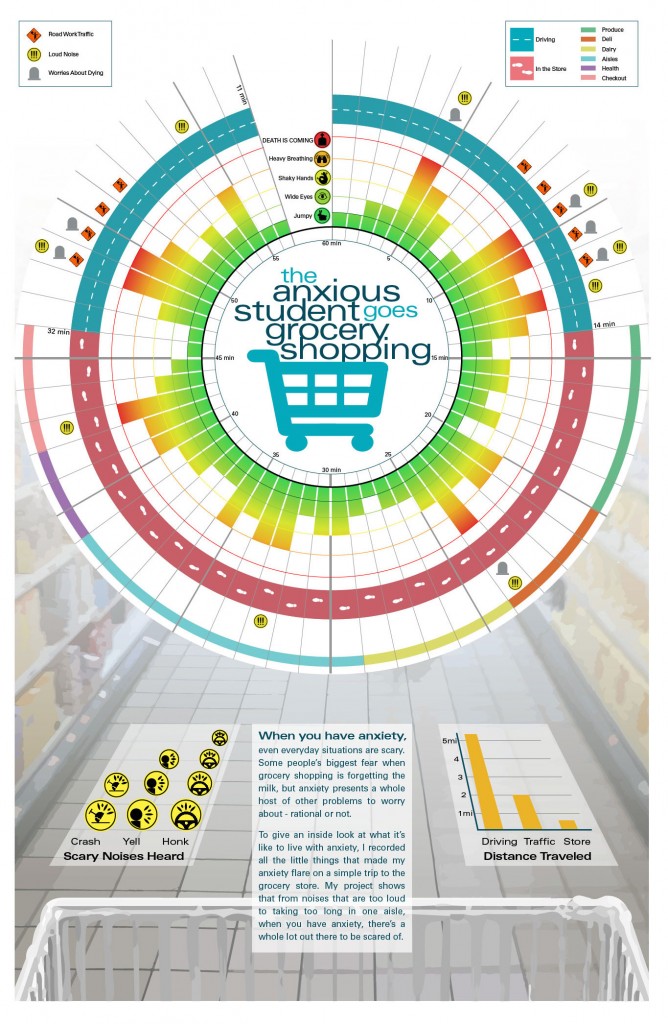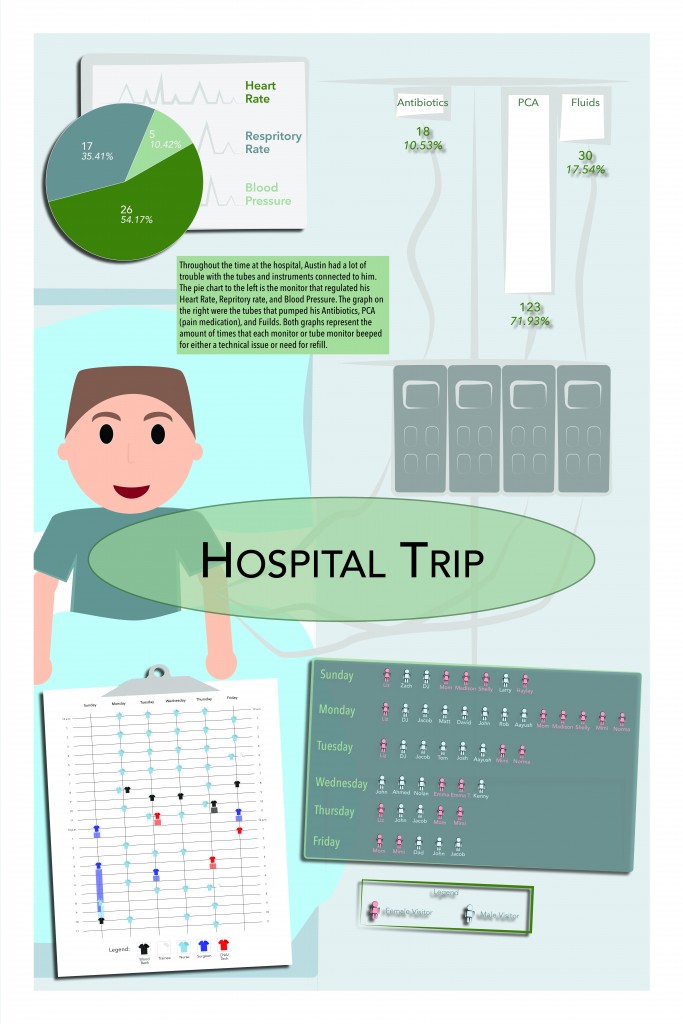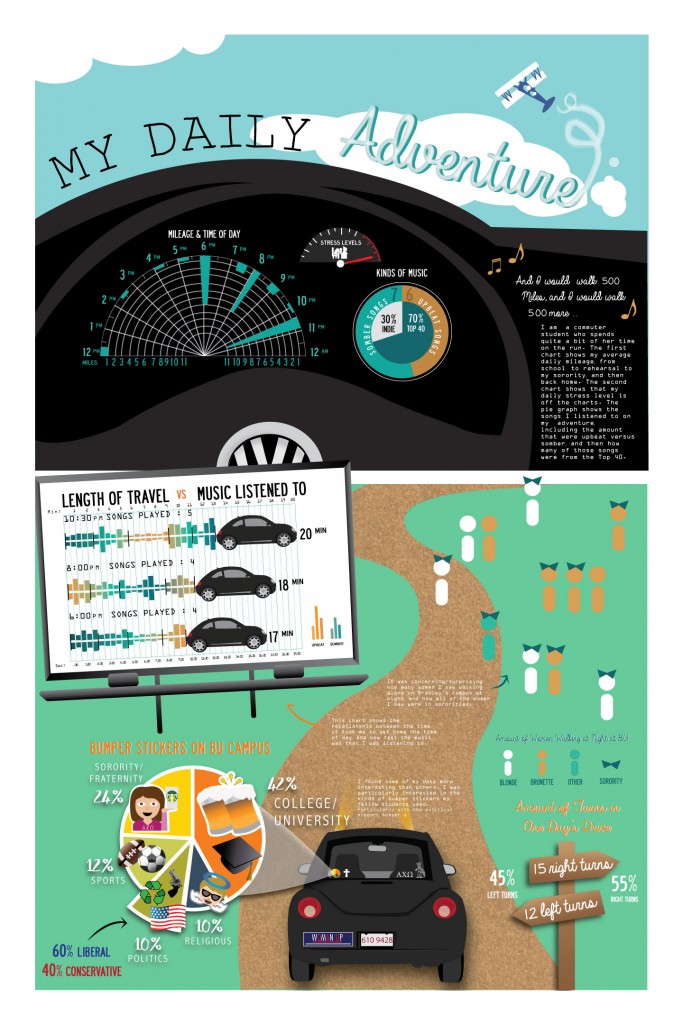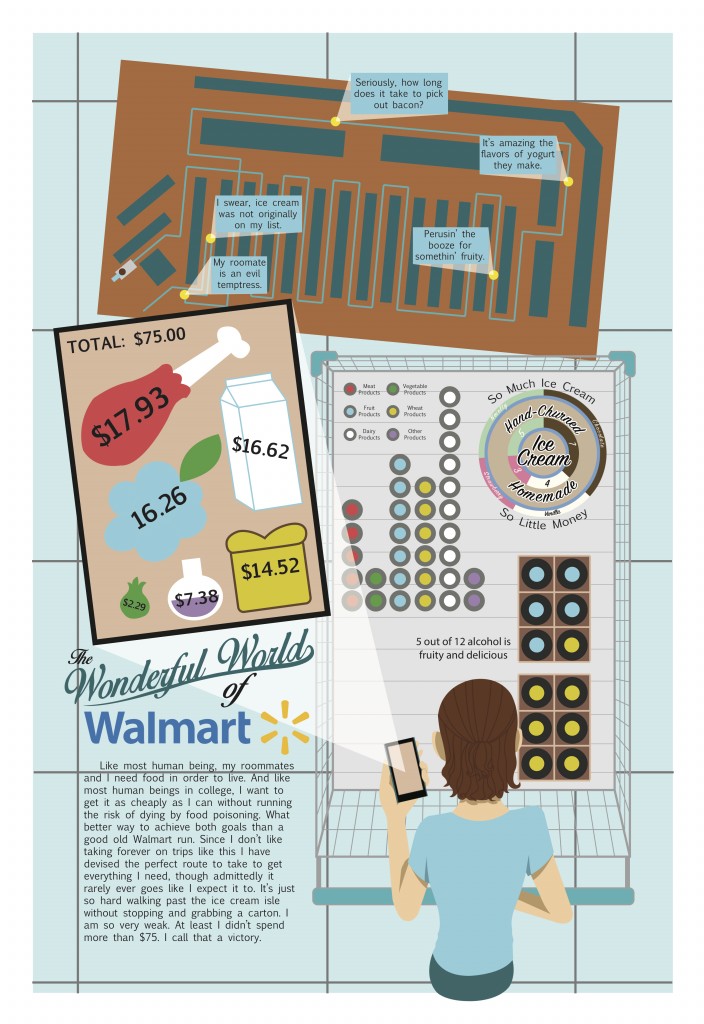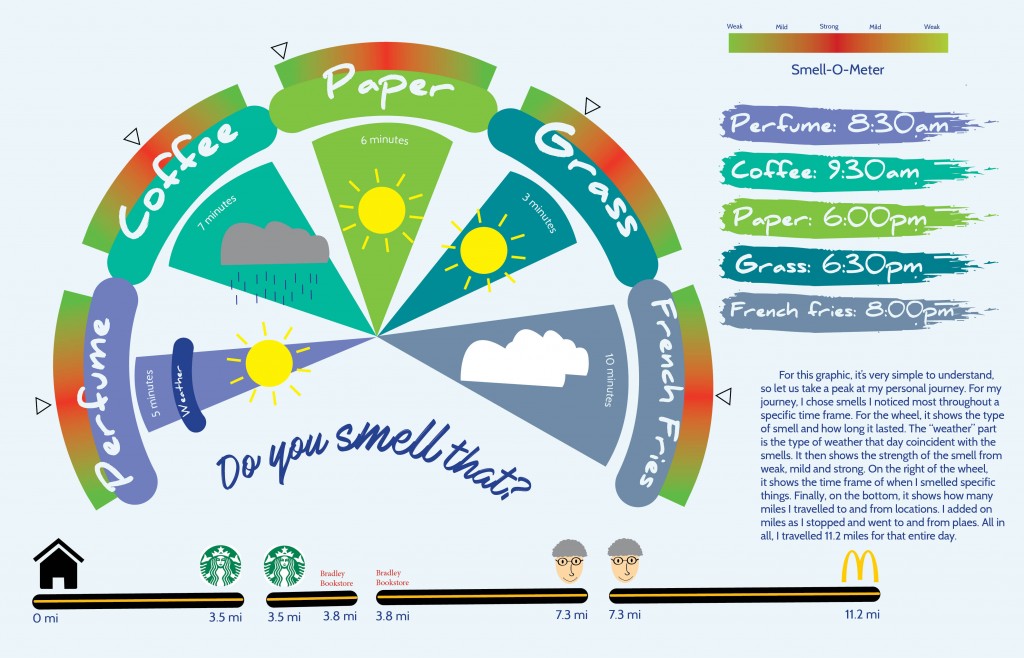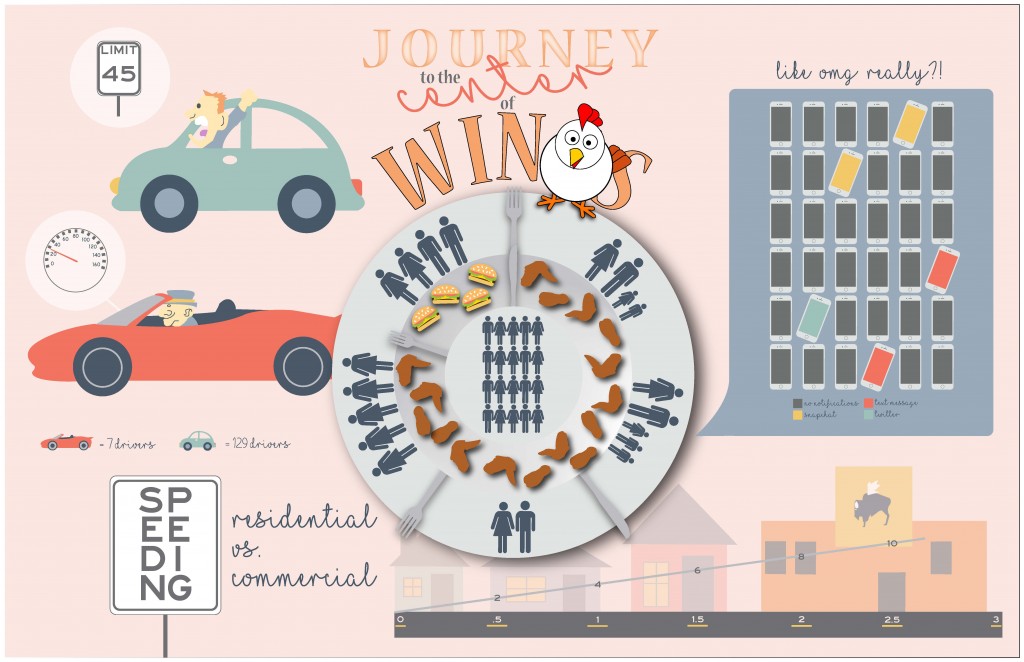

Nice introduction assignment into presentation of qualitative and quantitative data in a visual but clear and accurate way, retaining graphic integrity and truthful representation throughout. Each student had to research a personal journey of their choice and collate as much primary and secondary data as possible from that journey. Everything from the number of stop signs, to the breeds of dogs out walking. From the information collected, they then had to create a wallchart presenting it as a visual interpretation.

Tufte may hate his chart junk, but if the piece isn’t going to catch the eye first, then it’s no use to anyone.
Here are all the final pieces…