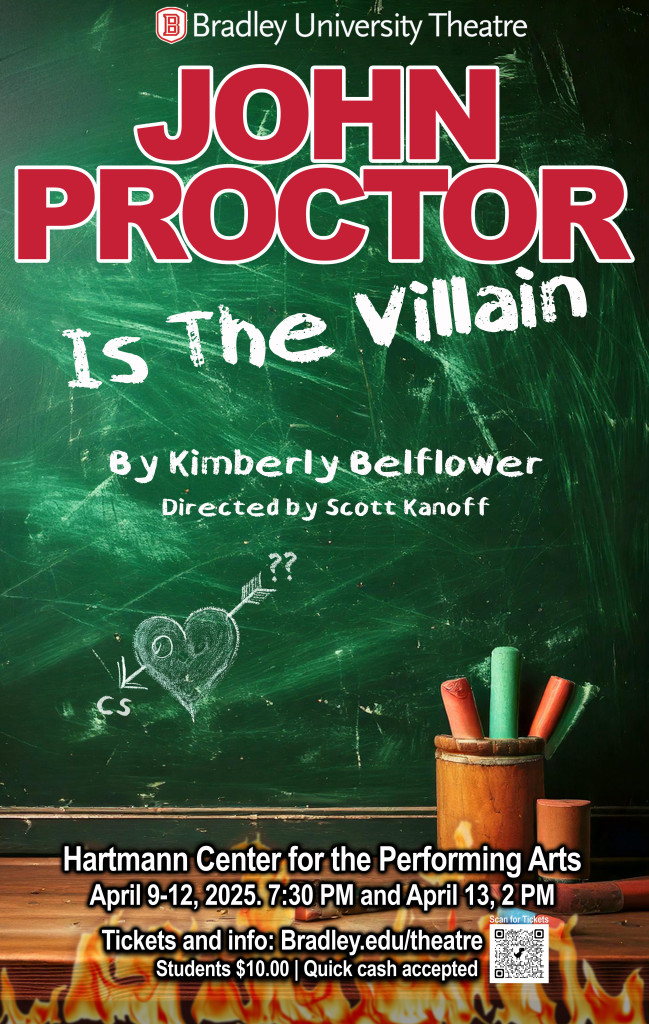
John Proctor Is The Villain

By Kimberly Belflower
Directed by Scott Kanoff

  April 9-13, 2025 in the Meyer Jacobs Theatre

At a rural high school in Georgia, a group of students study Arthur Miller’s The Crucible while navigating love, sex ed, and a few school scandals. Holding their own lens to the American classic, they begin to question who is really the play’s hero, and as their insights grow they discover their own agency as individuals and their power as a community of young women. Compelling, irreverent, and bitingly funny, this new comedy by an acclaimed American playwright captures a generation in mid-transformation, fueled by pop music, optimism, and fury.

The final production for the 2024-2025 season, and most likely my last collaboration with Scott Kanoff, who has been the most wonderful client to ‘bounce off’ for the past decade of theatre poster artwork.

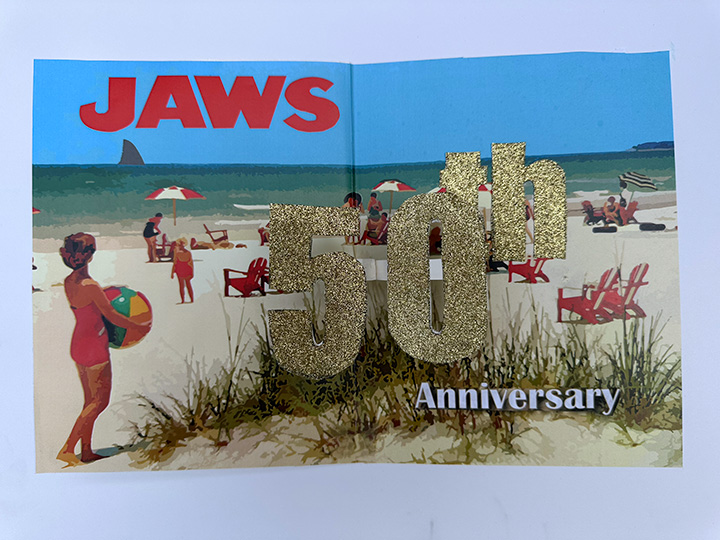
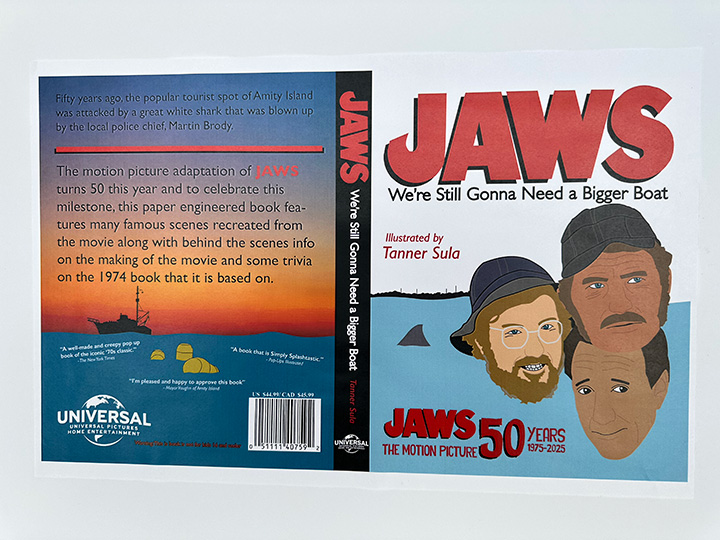
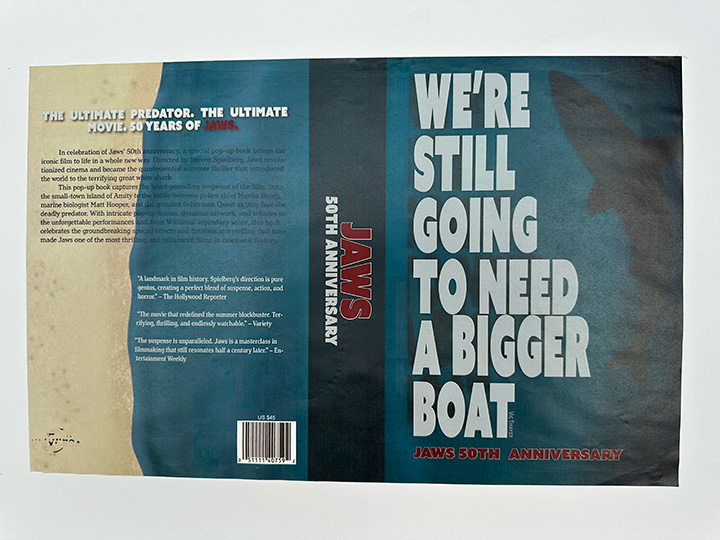
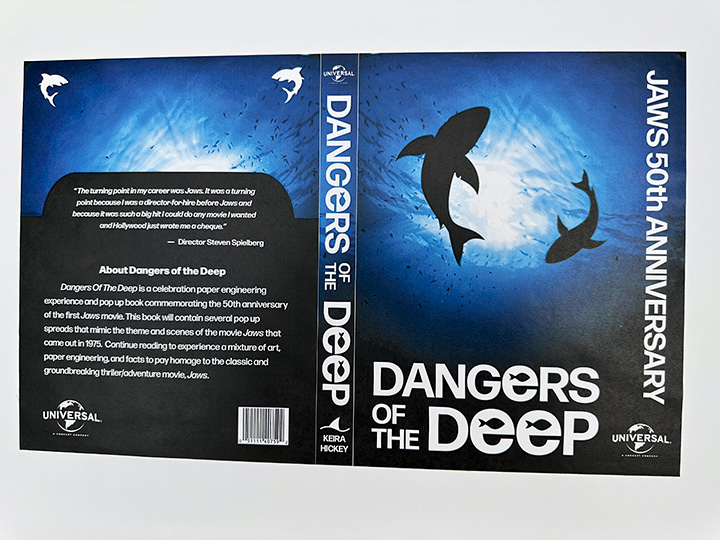
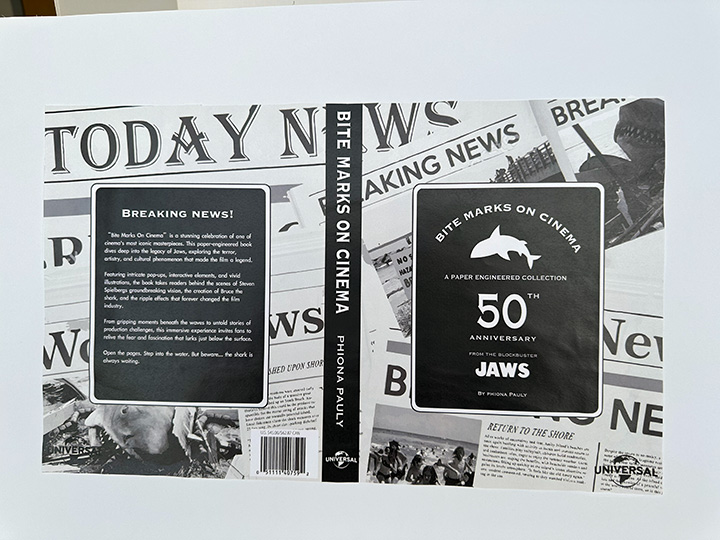
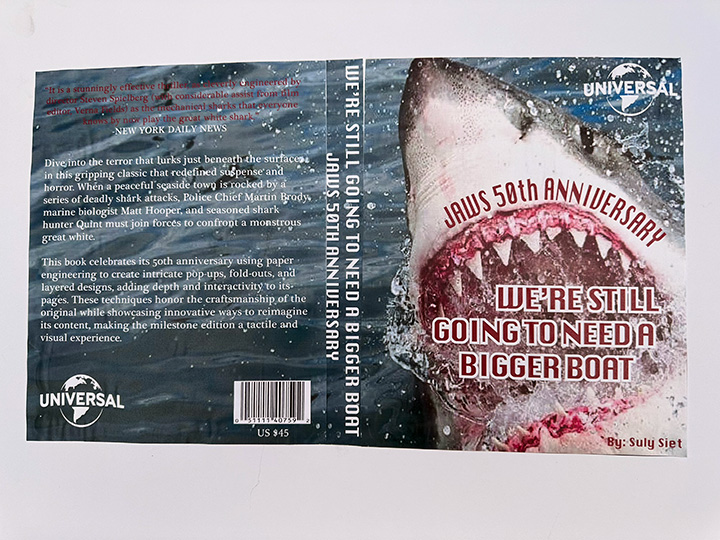
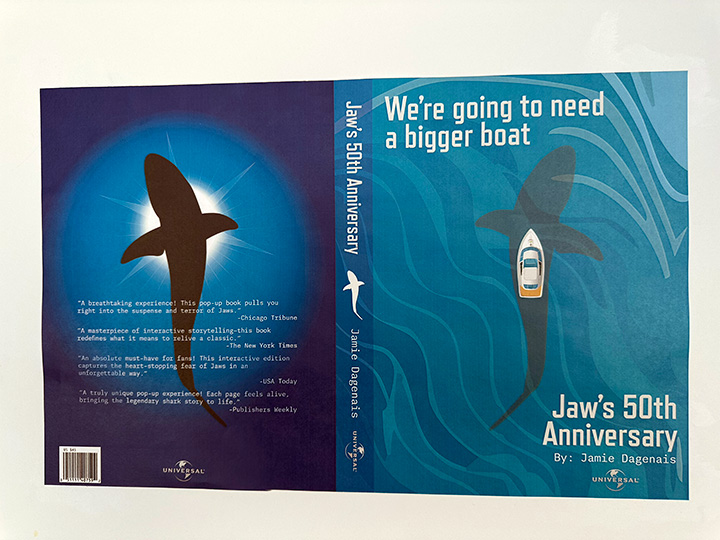
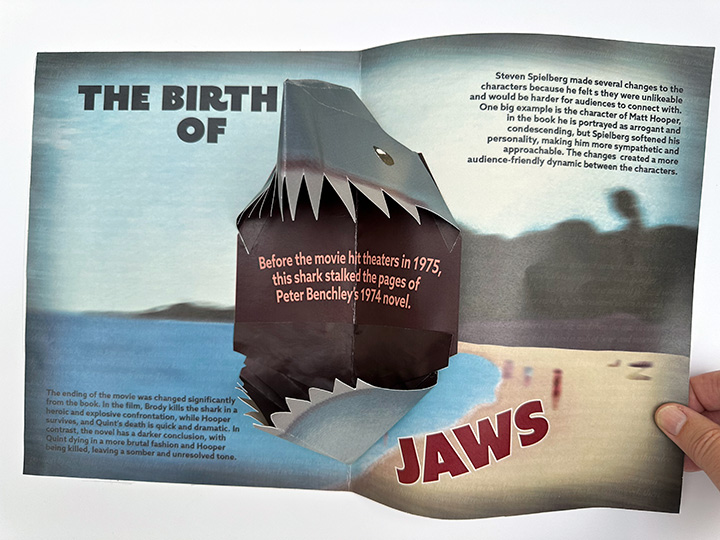
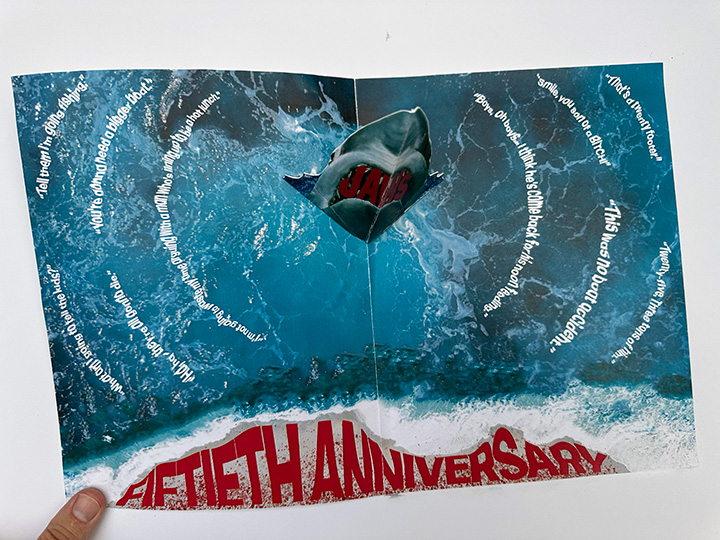
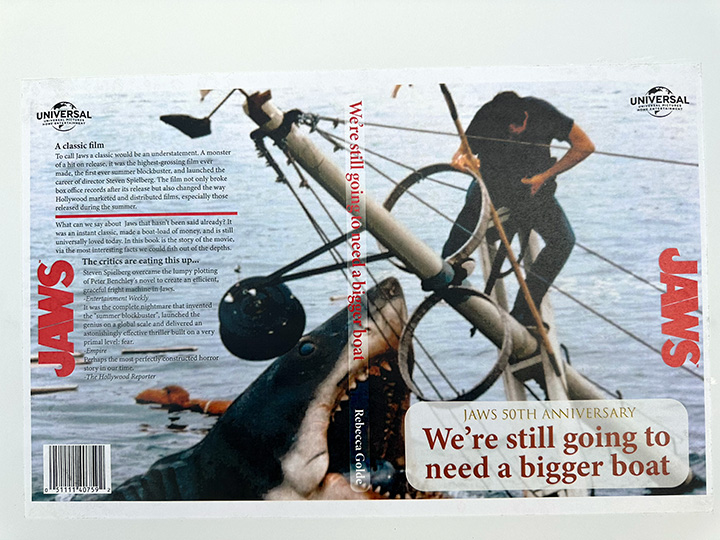
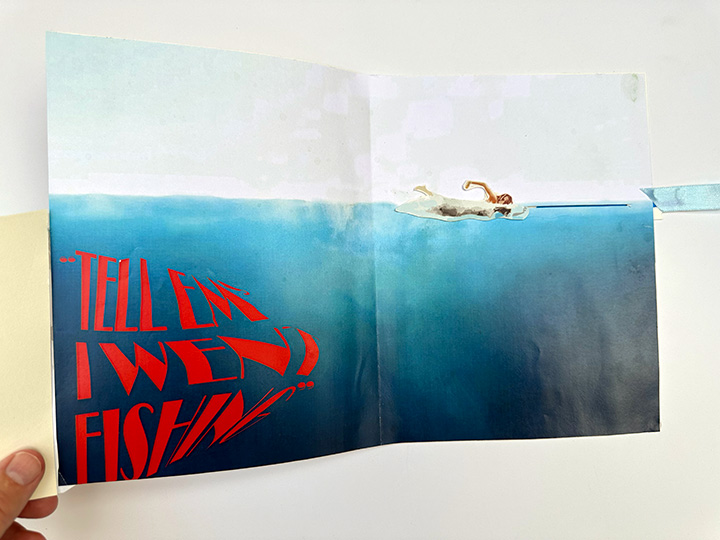
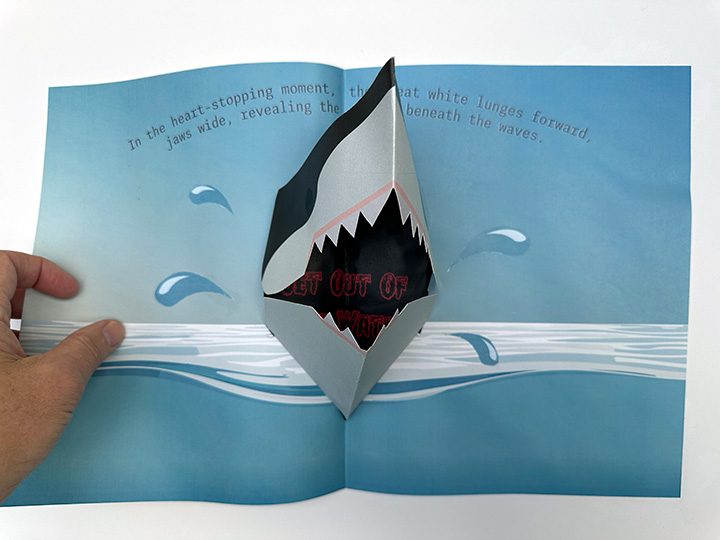
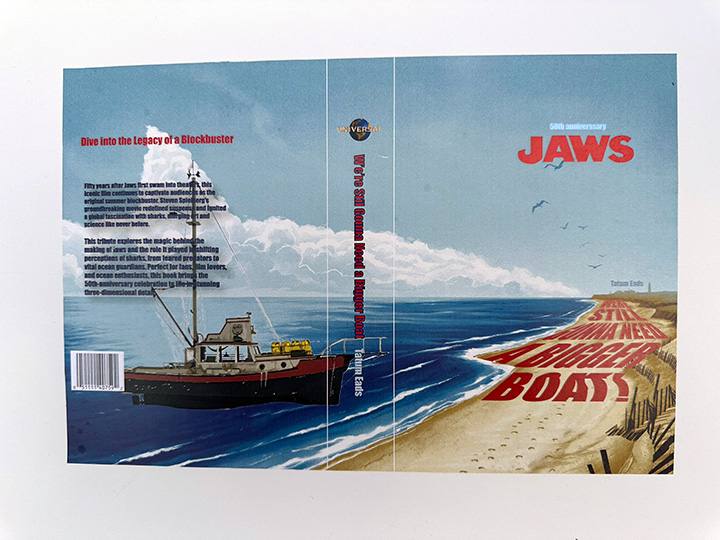
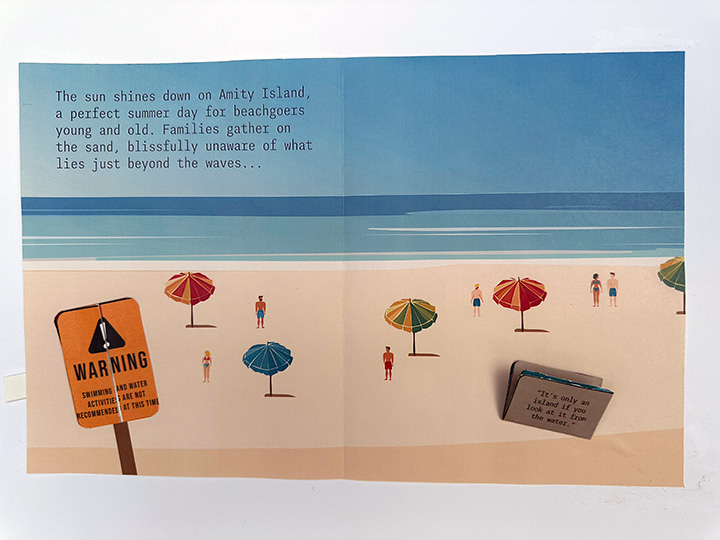
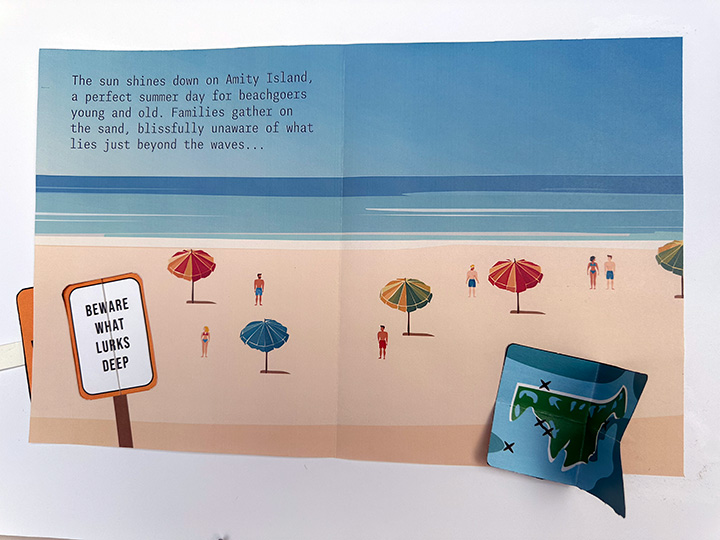
JAWS (the original motion picture) 50th Anniversary

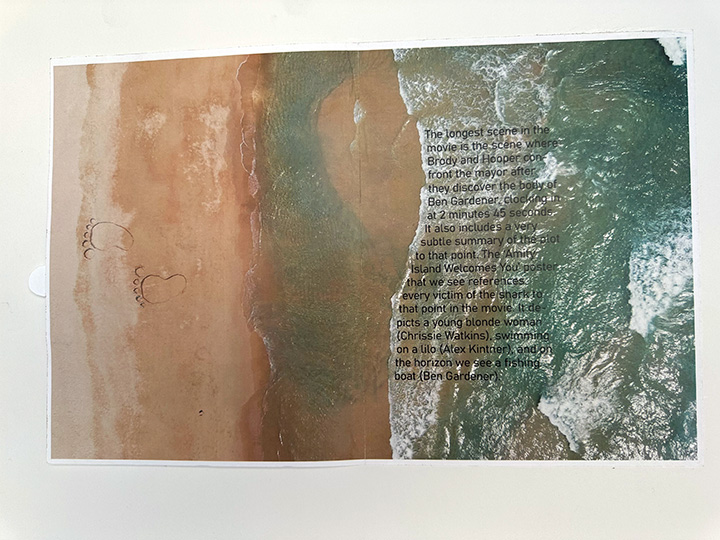
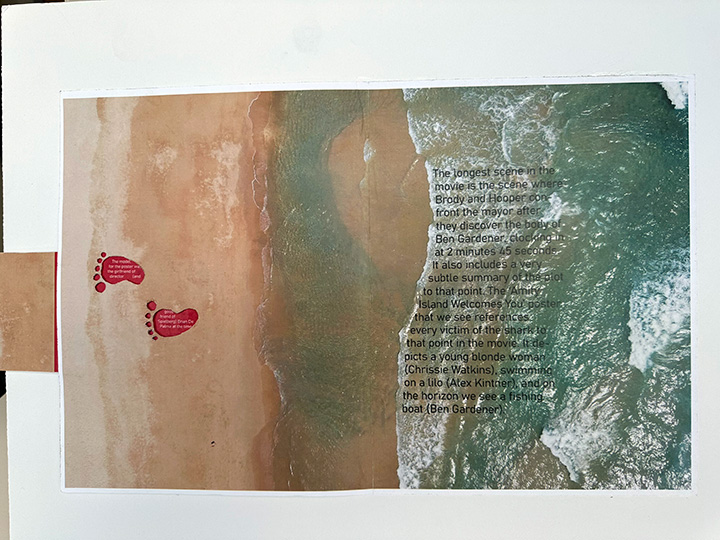
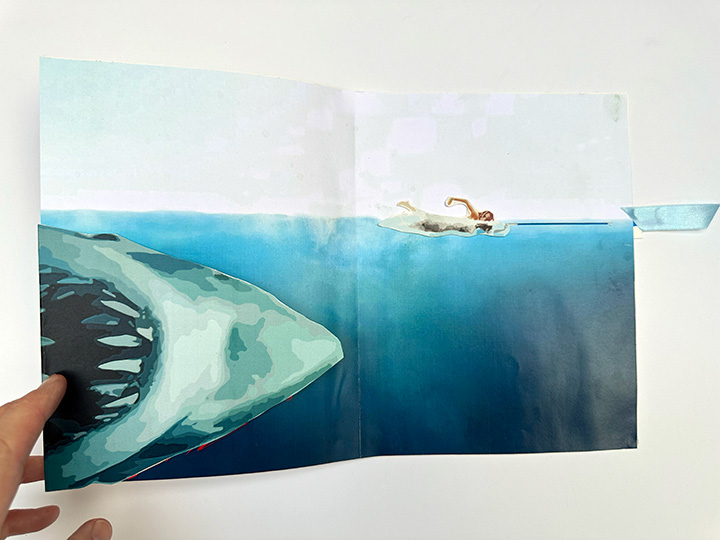
2025 see’s the 50th anniversary of the original motion picture – JAWS. And what better way to celebrate than with a coffee table paper engineered book. Here are some examples of the Editorial Design students book jackets and spreads (in no particular order).

“We’re gonna need a bigger boat”

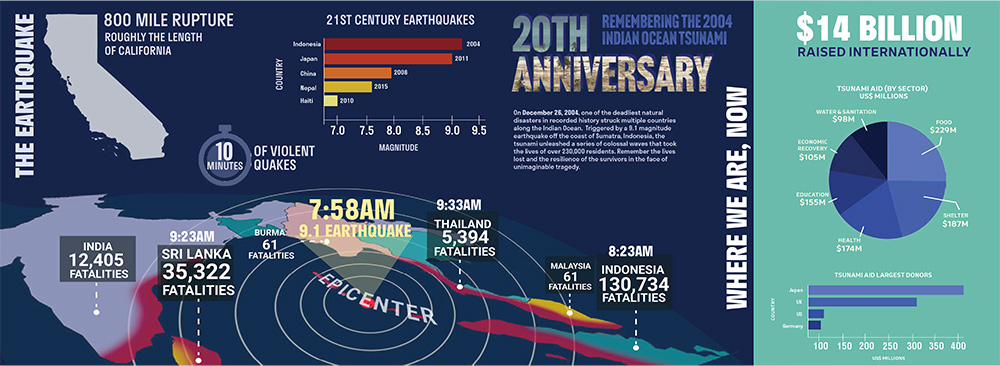
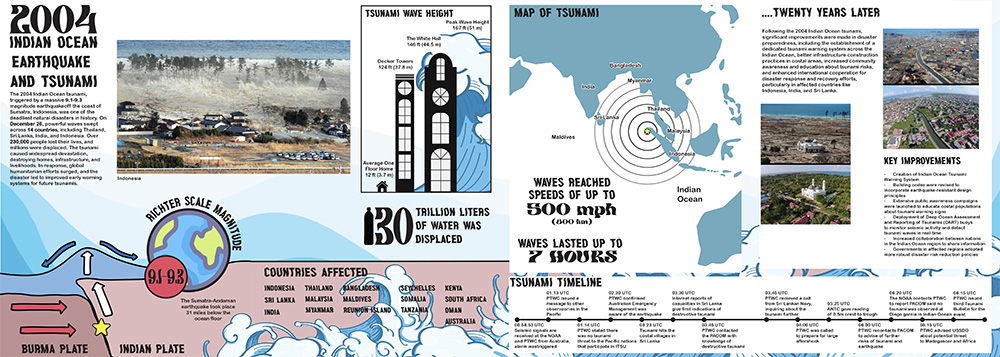
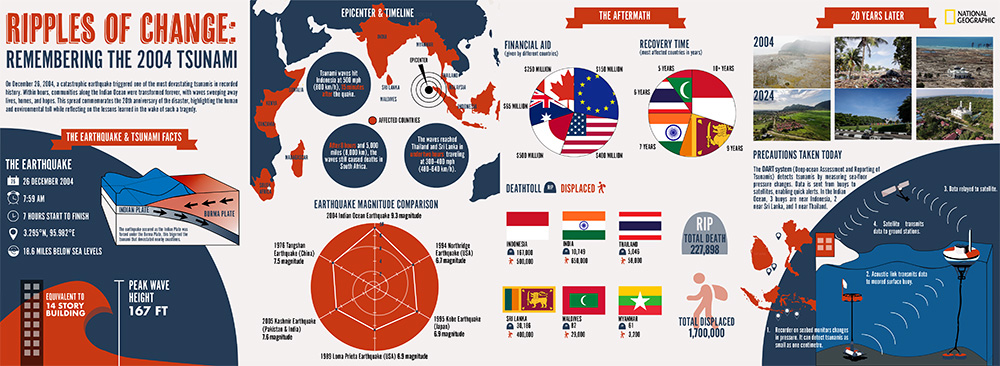
Chicago Beer Brewing Culture

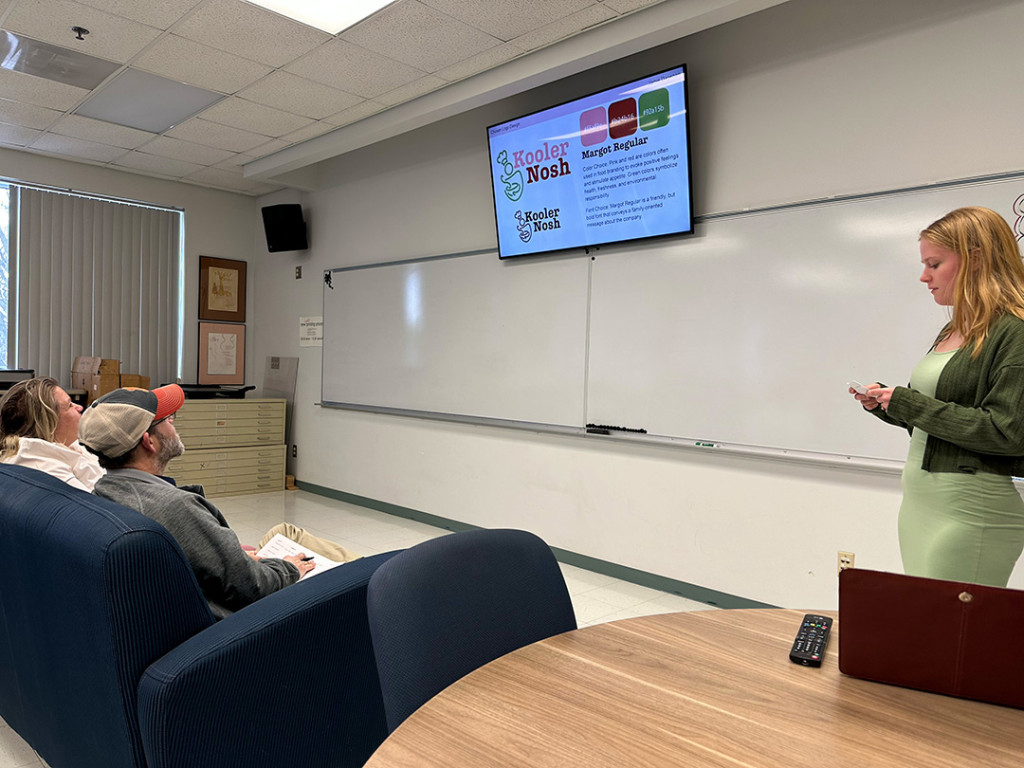
The final Information Design class of the semester saw the Senior Graphic Design students remotely present wall charts to Tanner Woodford, Founder & Executive Director and Kevin Reader, Executive Director of Programming & Operations, at the Design Museum of Chicago.

The subject of the wall charts was focused on the Chicago Brewery scene and the brewing process itself, and may well feature in a large exhibition at the museum proposed for next fall on the Chicago brewpub culture.

Great final assignment. Great group of students.

Continue reading “Chicago Beer Brewing Culture”

EARTHDAY MAGAZINE

It was nice to be teaching Editorial Design again after being away from it for a few years. The magazine assignment is always a good one to demonstrate grids, unique use of type, and art direction of imagery.

Each student was required to demonstrate a title/masthead, cover, image heavy, opening story spread, and two text heavy spreads. Unfortunately, we didn’t have the time to develop the digital version of the magazine. Here is a selection of the more successful results.
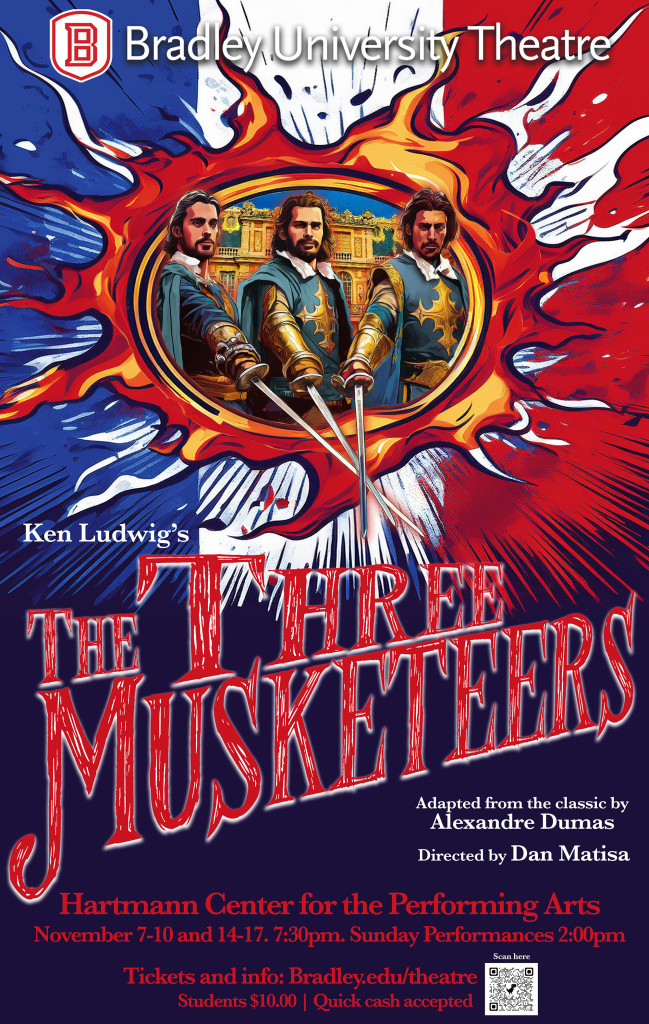
KEN LUDWIG’S THE THREE MUSKETEERS

Adapted from the classic by Alexandre Dumas
Directed by Dan Matisa with thrilling fight choreography by BU Theatre alum Justin Verstraete.

 November 7-10 and 14-17, 2024 in the Meyer Jacobs Theatre

From the acclaimed comic master Ken Ludwig (Lend Me a Tenor, Crazy for You, Moon Over Buffalo), this adaptation, rendered afresh with Ludwig’s hilarious, over-the-top style, is based on the timeless swashbuckler by Alexandre Dumas. It’s a tale of heroism, treachery, close escapes, and above all, honor.

Wayfinding System Presentations for the Peoria Regional Learning Center

A wonderful opportunity for the students to work on a wayfinding ‘challenge’.

Peoria Regional Learning Center was looking for a simple but effective signage system to navigate from the parking lot, into the building, through to classrooms, kitchen, reading room and assorted administration and utility spaces, while creating a vibrant learning environment.

Great job by all seven student teams, and a big thank you to Teresa Von Rohr and her colleagues for giving us the opportunity.

Personal Journey Data Wallchart

Always good as an intro into visualizing data.

Pick a ‘journey’ you make frequently/repeatedly. Document as much data and observations as possible during the period of time your own personal journey takes, recording both quantitative and qualitative observations. These can be the obvious ones such as the number of cars passing you on your journey, to harder to quantify observations such as the different choices of music you select on your journey. It is a personal journey that may include non-tangible narrative information (what were you thinking at certain points of the trip, moods, sounds etc?) alongside more obvious, measurable data points, such as time, distance etc.  Consider temperature variations, periods of time, speed, pace, direction etc.

From your research and body of data – create a wallchart (22″ x 18″ plus an additional 1/2″ white border all around. Portrait or Landscape). Make it a compositional piece, include additional data sets, a logo-title (not simply in Helvetica – ‘design’ the title), and a small introductory block of body text. This should be a coherent piece that clearly, and accurately, visually communicates a large amount of qualitative and quantitative information and data about your personal journey. It should have some elements of your ‘personality’ in it, after all – it is all about you.