
Always good as an intro into visualizing data.
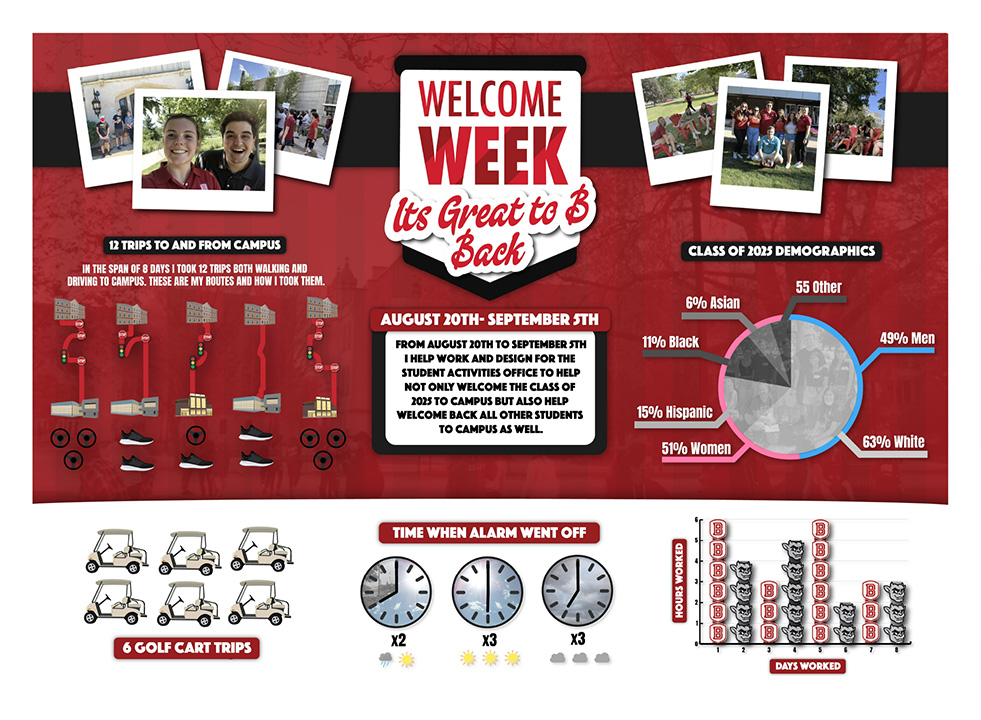
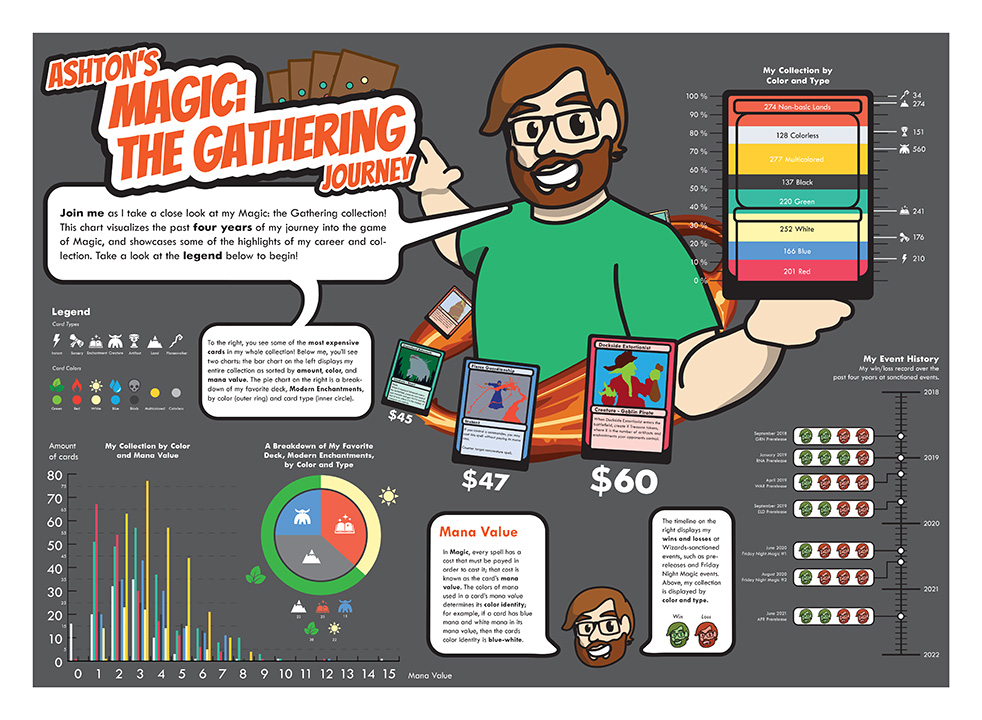
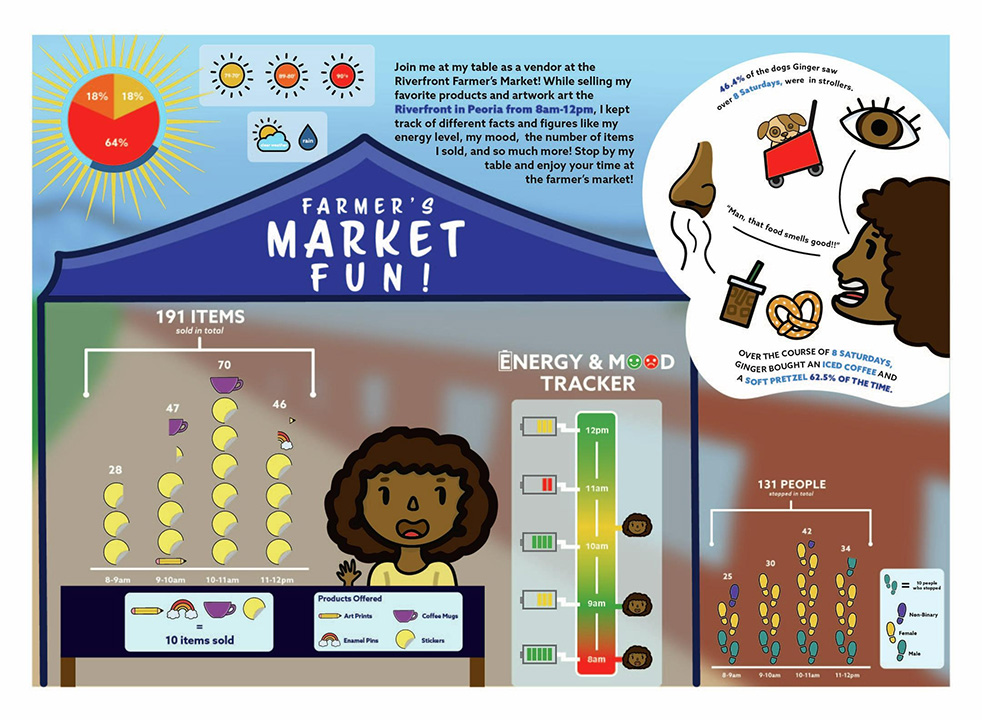
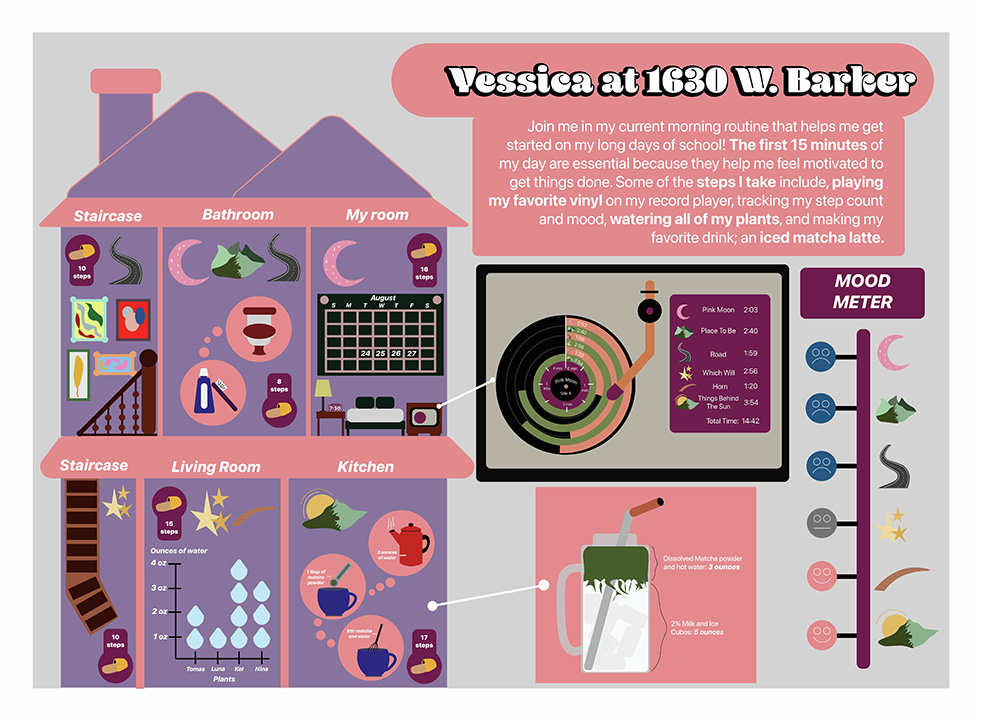
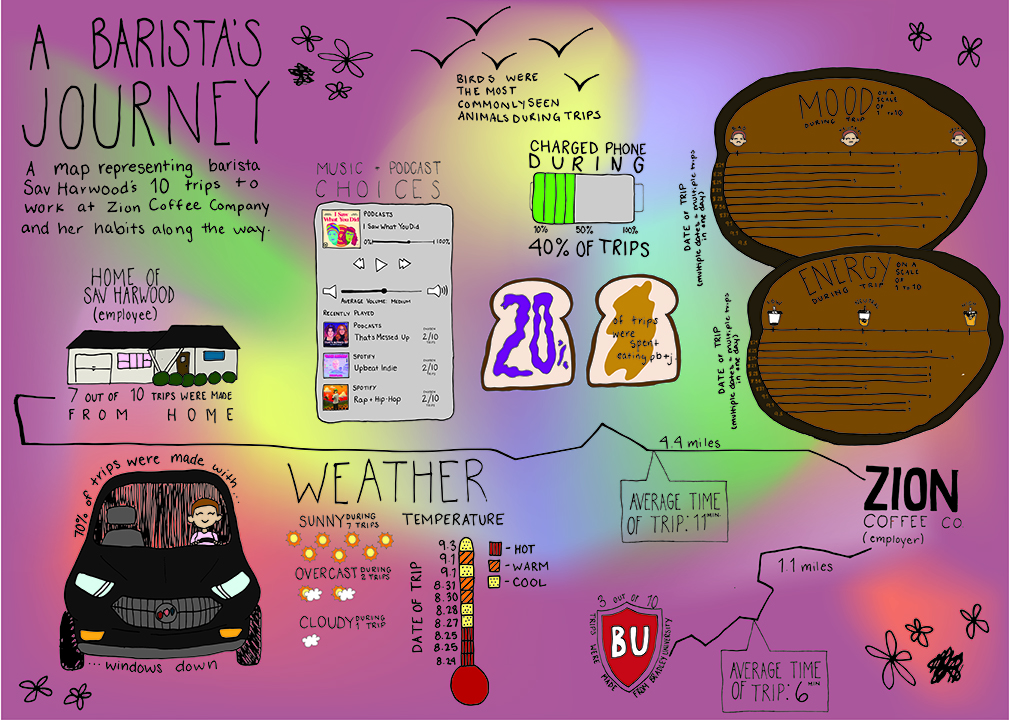
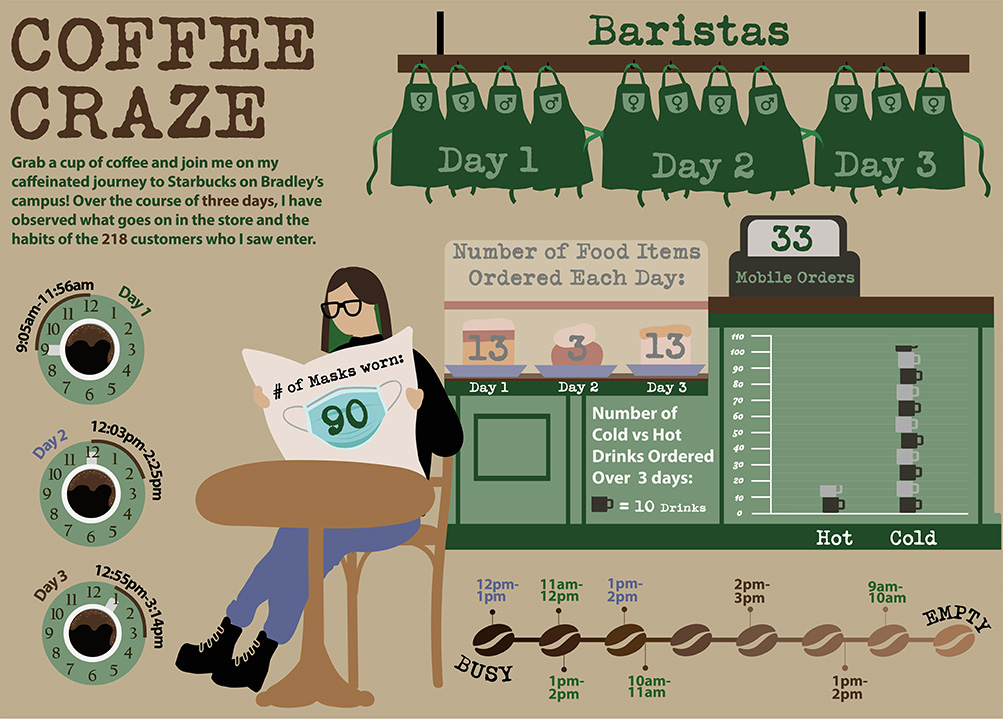
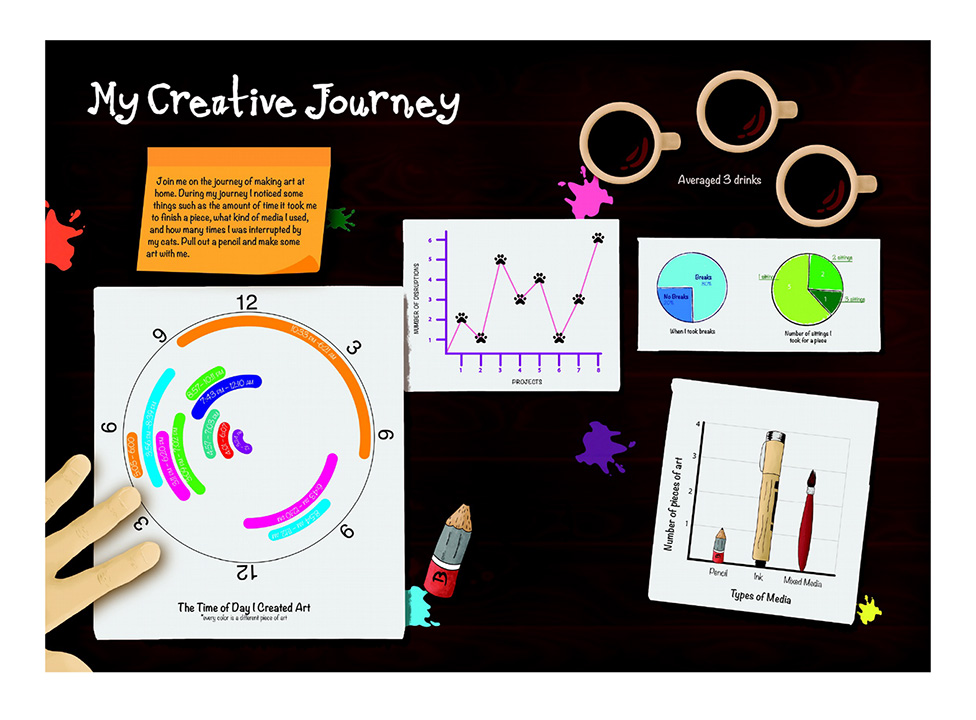
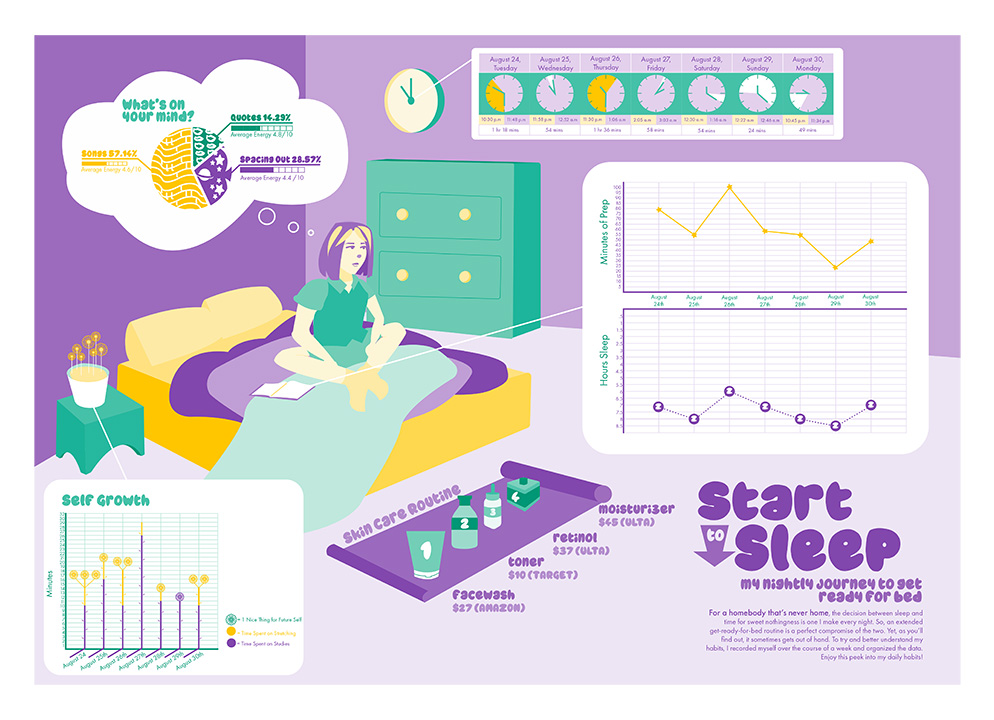
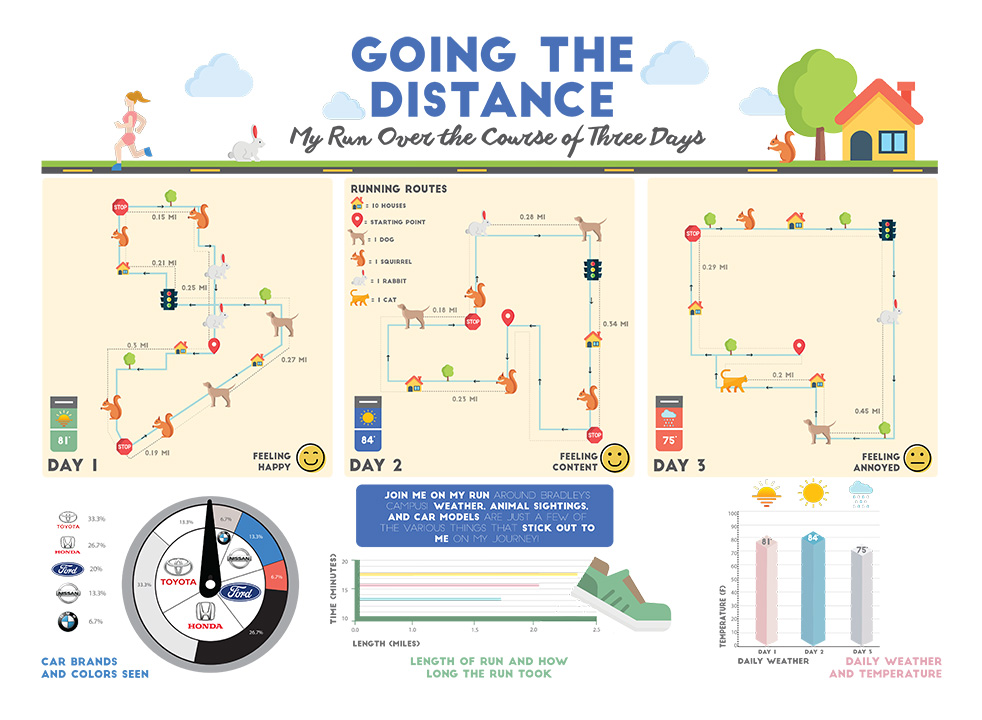
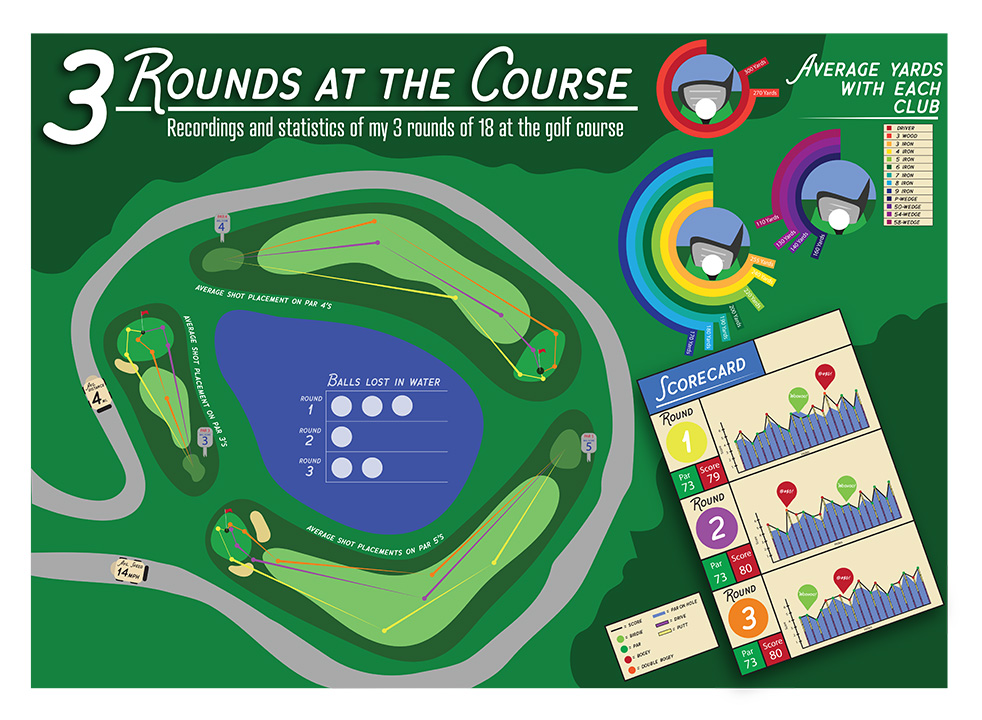
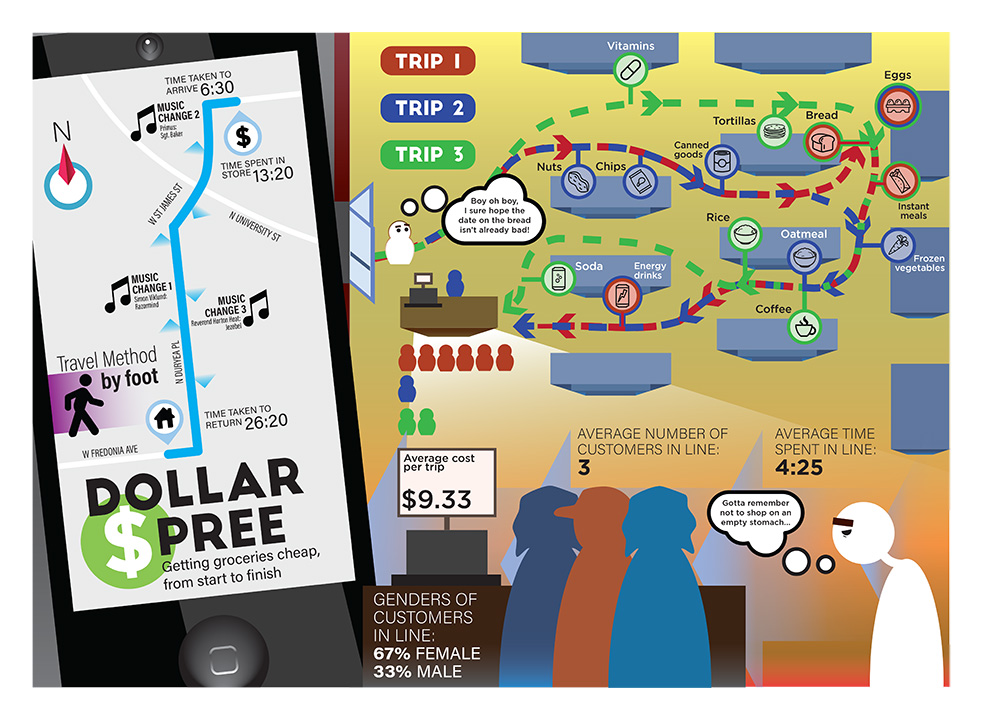
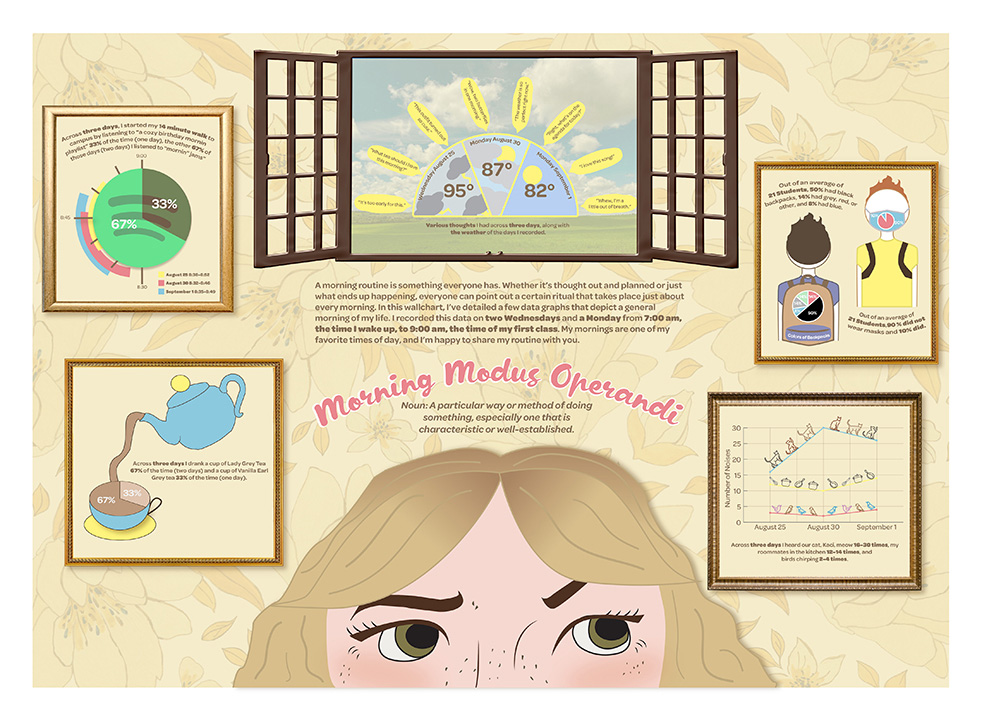
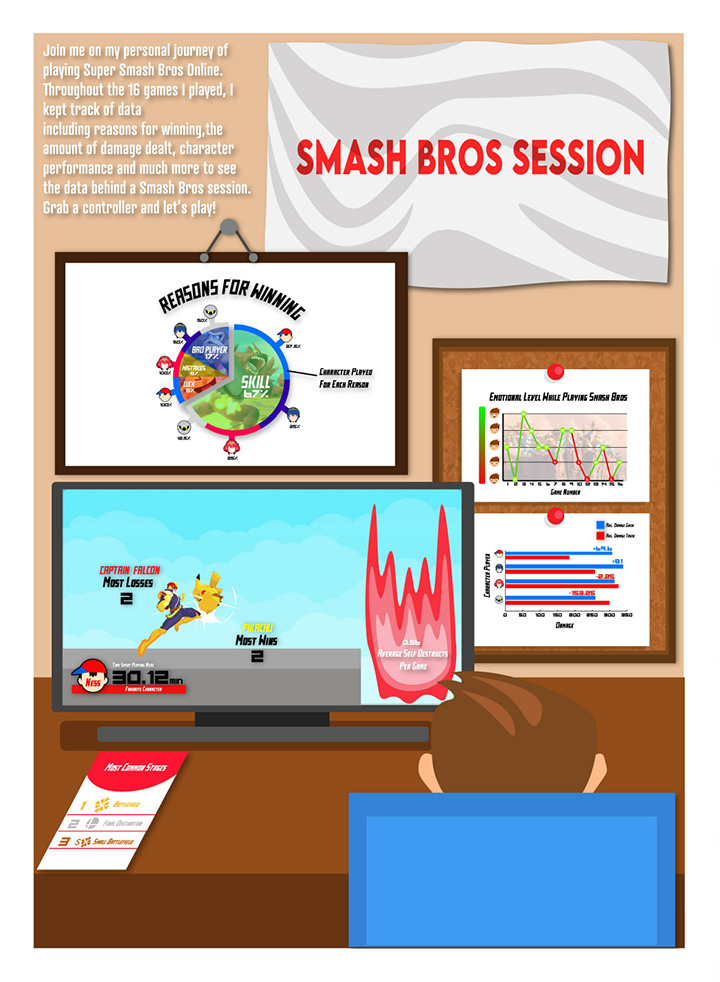
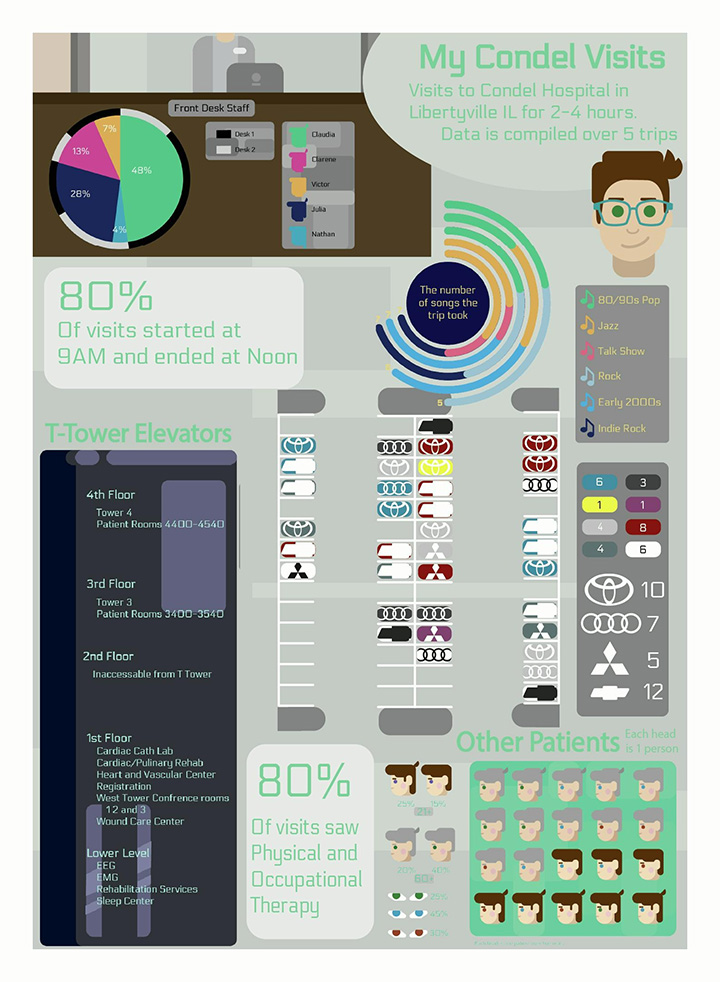
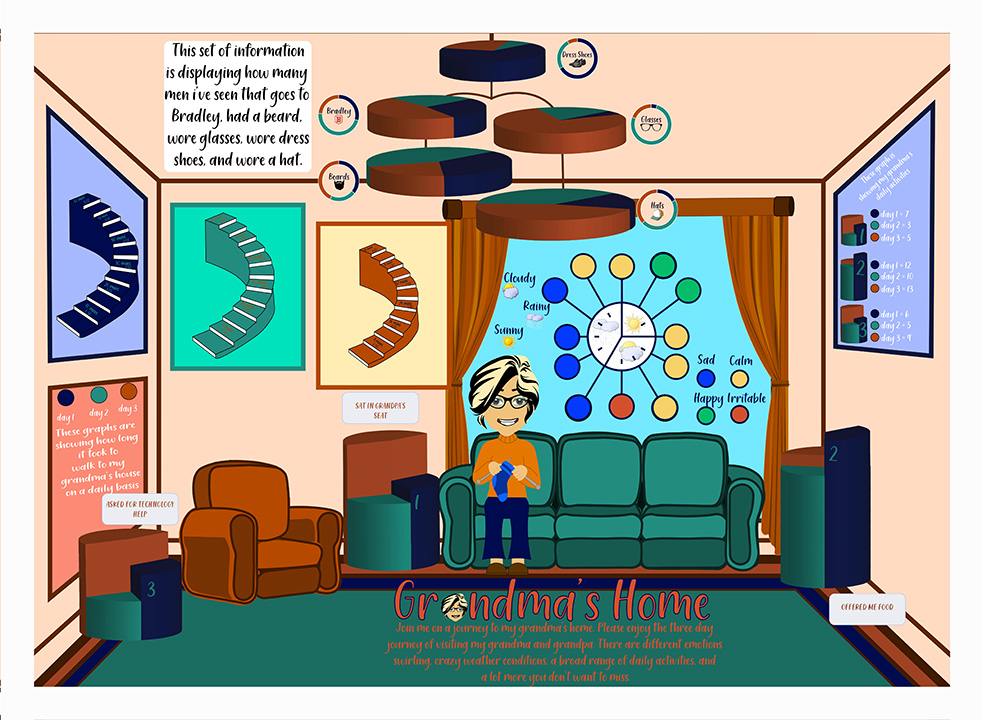
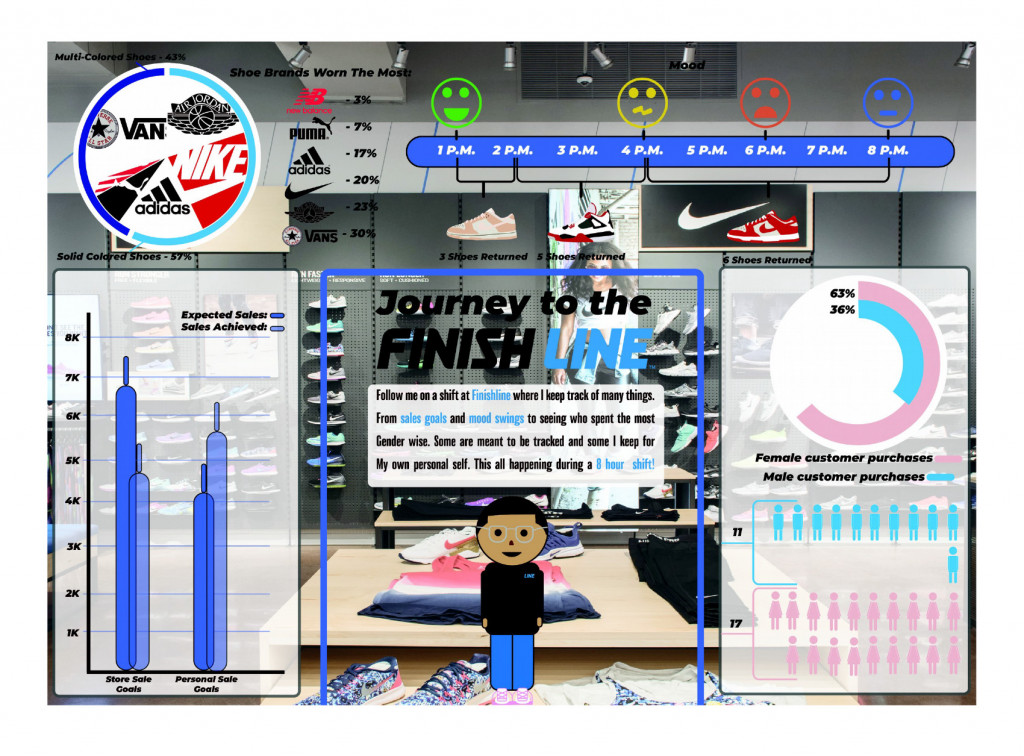
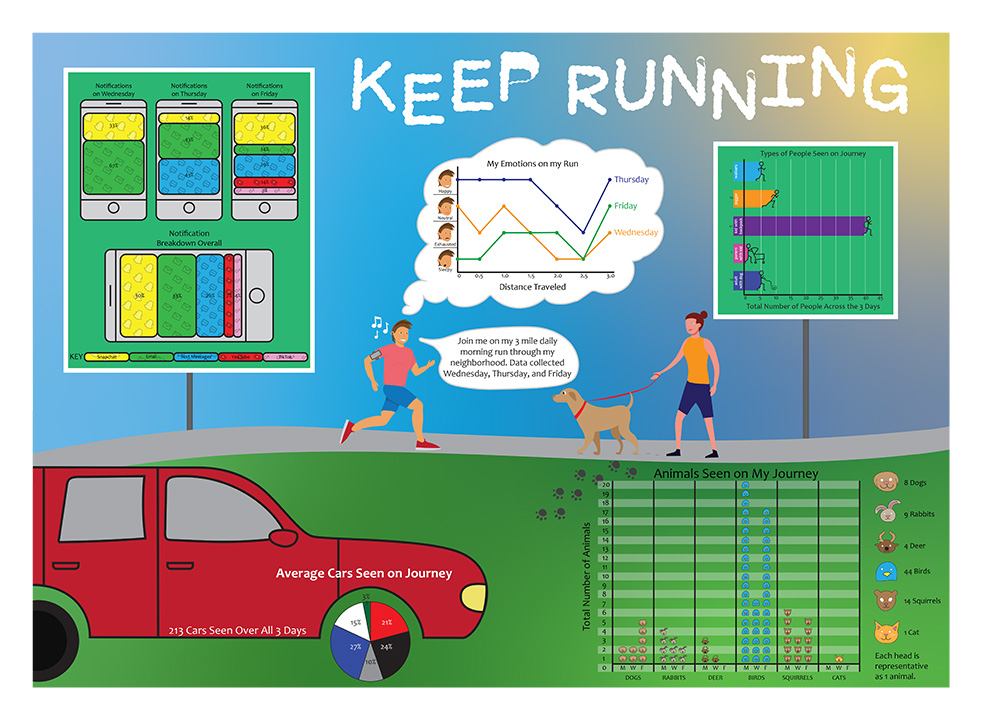
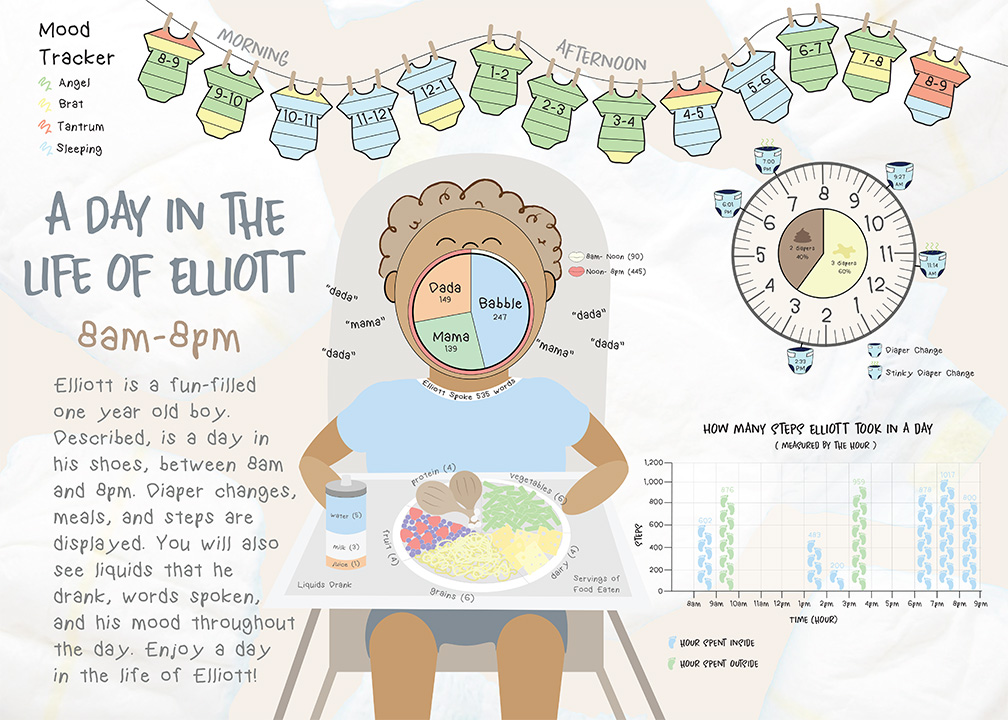
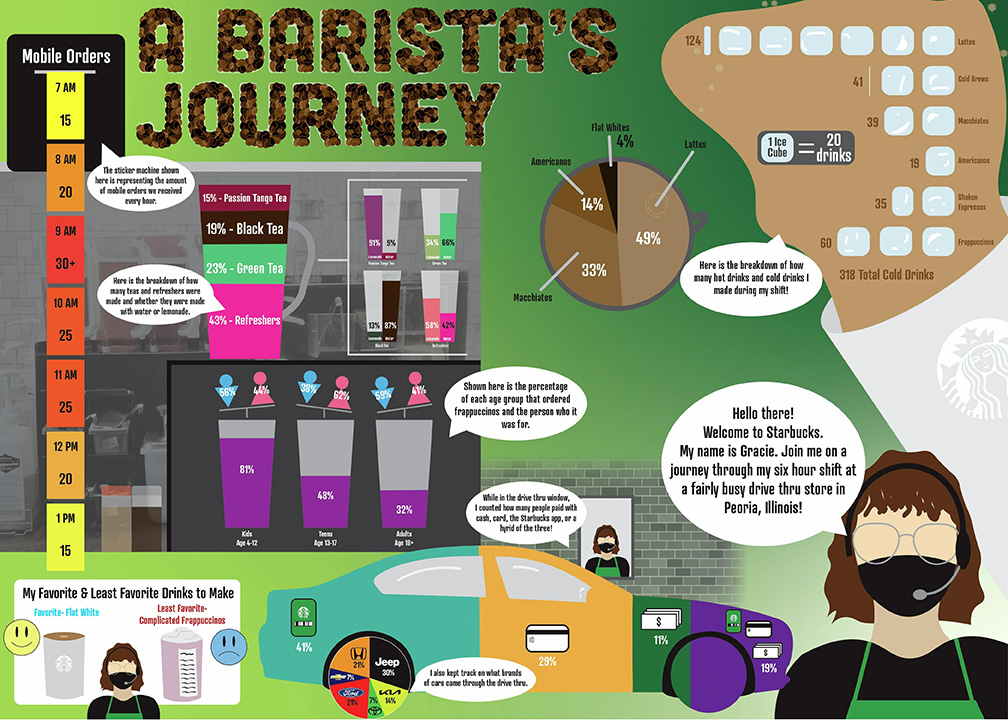
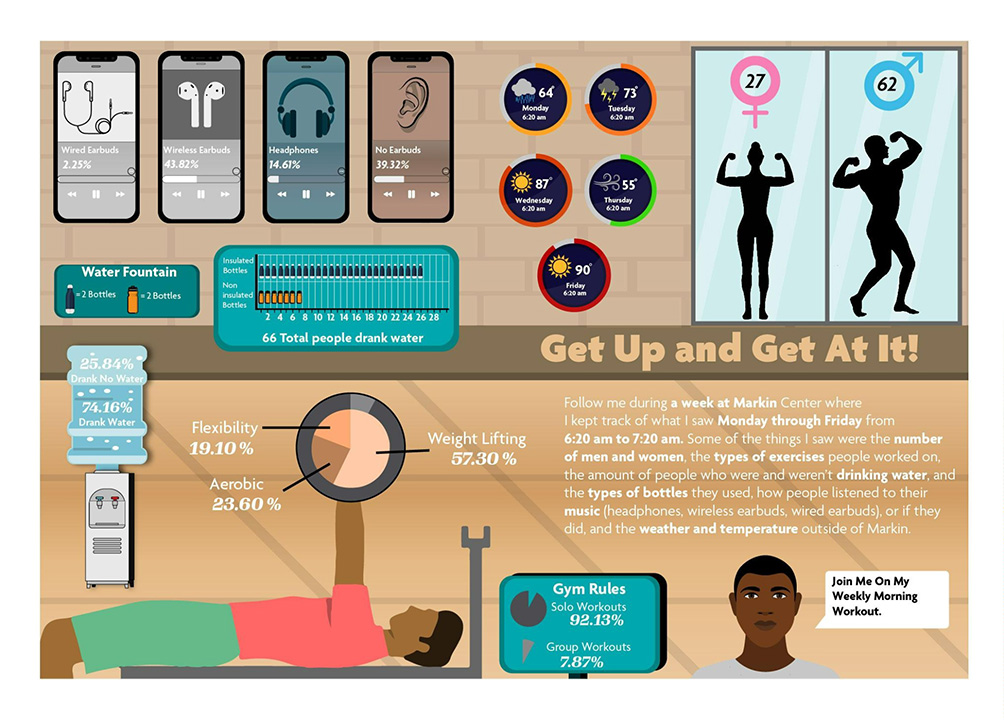
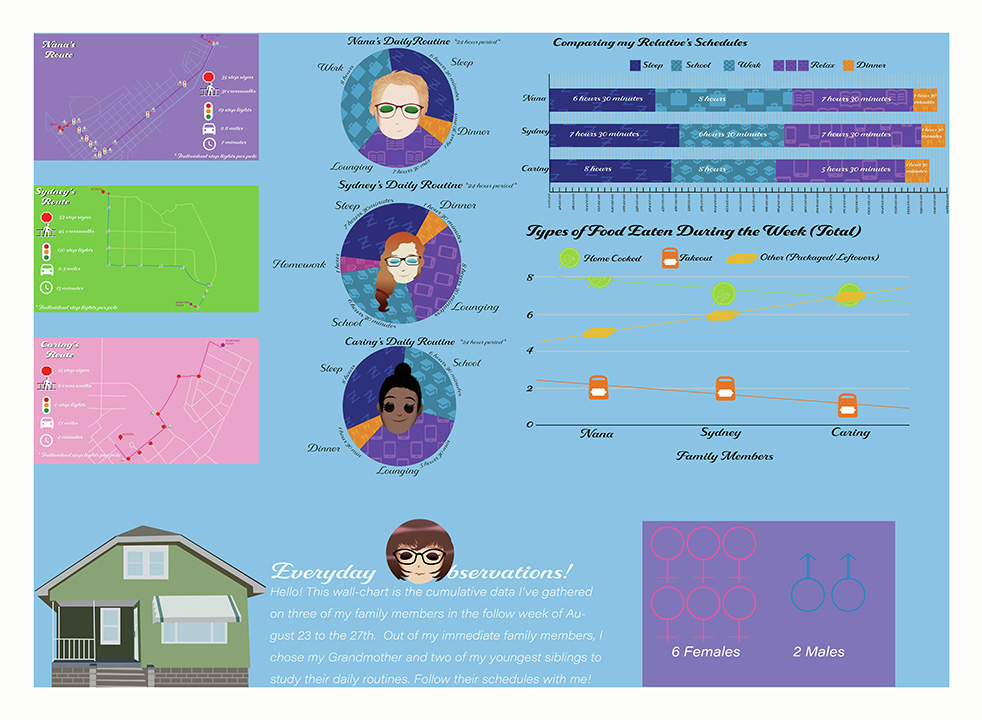
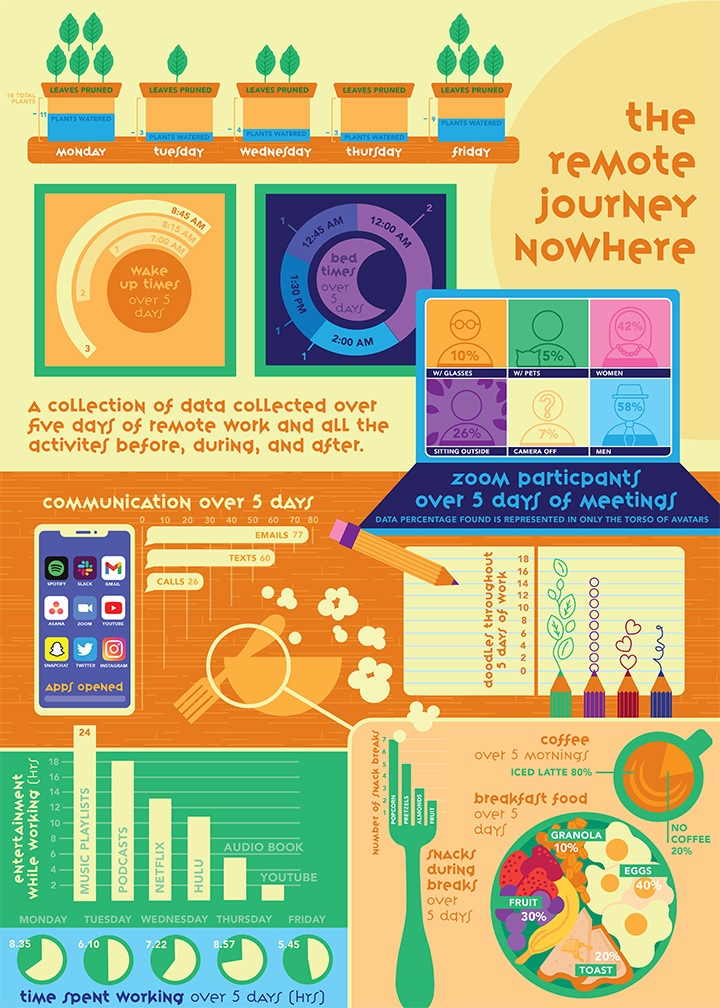
Pick a ‘journey’ you make frequently/repeatedly. Document as much data and observations as possible during the period of time your own personal journey takes, recording both quantitative and qualitative observations. These can be the obvious ones such as the number of Toyota cars passing you on your journey, to harder to quantify observations such as the different choices of music you select on your journey. It is a personal journey that may include non-tangible narrative information (what were you thinking at certain points of the trip, moods, sounds etc?) alongside more obvious, measurable data points, such as time, distance etc. Consider temperature variations, periods of time, speed, pace, direction etc.
From your research and body of data – create a wallchart (28″ x 20″ plus an additional 1″ white border all around. Portrait or Landscape). Make it a compositional piece, include additional data sets, a logo-title (in other words, not simply helvetica), a subtitle, if necessary, and a small introductory block of body text. This should be a coherent piece that clearly and accurately visually communicates a large amount of qualitative and quantitative information and data about your personal journey. It should have some elements of your ‘personality’ in it, after all – it is all about you.